Project risk mitigation means taking planned action, before a threat materialises, to reduce its probability or its impact on cost, schedule, scope, and quality. The ten strategies that follow cover identification, ownership, quantification, reserves, contractual transfer, monitoring, communication, escalation, gate reviews, and lessons learned, each with a worked figure and a named standard behind it.
On 26 February 2026 the Government Accountability Office reported that the National Nuclear Security Administration’s cumulative cost overrun on major projects had grown from $2.1 billion to $4.8 billion since 2023, and its cumulative delay from 9 years to 30 years, according to GAO-26-107777. The portfolio is worth more than $30 billion.
Two buildings at the Y-12 Uranium Processing Facility caused most of that overrun, and GAO traced the causes to contractor project management, vendor performance, and rising material costs. None of those is a surprise risk. Each appears in a standard register, so mitigation is mostly a discipline of doing the known things on time.
| The Practitioner’s Cheat Sheet: Project Risk Mitigation |
| Project risk mitigation is the set of actions that lower the probability or impact of identified threats before they hit cost, schedule, or scope, and it sits inside the wider risk response toolkit of avoid, transfer, mitigate, accept, and escalate. |
| GAO reported in February 2026 that NNSA’s portfolio of major projects grew its cumulative cost overrun from $2.1 billion to $4.8 billion and its cumulative delay from 9 to 30 years in two years; two Uranium Processing Facility buildings drove most of it. |
| Wellingtone’s March 2026 survey found only 36% of organisations mostly or always deliver on time; PMI’s 2025 Pulse put budget adherence at 73% for leads with high business acumen against 68% for the rest. |
| Contingency should follow estimate class: AACE-derived ranges run from -30/+50% at Class 5 to -5/+10% at Class 1, so a fixed 10% reserve is wrong at both ends. |
| Every risk needs one named owner, a trigger, a dated response, and a residual score in the register; a risk with no owner is a risk nobody is mitigating. |
| Honolulu’s Skyline rail grew from about $5 billion in 2011 to a projected $10.19 billion in August 2026, with the current schedule carrying no float to its March 2031 finish. |
| The ten strategies are: identify early, assign owners, quantify, reserve, contract the transfer, monitor with triggers, communicate, escalate, review at gates, and capture lessons into the next register. |
What Project Risk Mitigation Means and Where It Sits
Mitigation is one of five responses to a threat. The PMBOK Guide lists escalate, avoid, transfer, mitigate, and accept for threats, and escalate, exploit, share, enhance, and accept for opportunities, as Project Management Academy summarises. Choosing mitigate means keeping the risk and spending now to shrink it; our risk response planning guide covers the choice.
| Response | PMI definition (threats) | Typical project action | Cost signature |
| Escalate | Raise to a level with authority outside the project | Sponsor decision on a regulatory or funding risk | None to project; sits on programme budget |
| Avoid | Eliminate the threat or protect the project from its impact | Drop a scope element, change the site, change the method | Scope or benefit reduction |
| Transfer | Shift the impact to a third party | Insurance, fixed-price contract, performance bond, warranty | Premium or contractor risk margin |
| Mitigate | Reduce the probability or impact of the threat | Prototype, second supplier, early permit, added QA | Direct spend now, lower expected loss later |
| Accept | Take no action unless the risk occurs | Contingency reserve and a trigger for its release | Reserve held, released only on trigger |
The definitions matter because teams mislabel reserves as mitigation. A contingency reserve is acceptance with money attached and does nothing to the probability of the risk, whereas mitigation changes the risk itself. The ISO 31000 standard makes the same distinction under risk treatment, and the complete guide to risk mitigation in project management covers the wider process this article assumes.
One boundary for this piece: it covers threats only. Exploiting and enhancing upside events uses a different playbook, which we set out in positive risk in project management. The ten strategies below are the threat side, ordered in the sequence a project actually runs them, from the first workshop to the closing report.
Why Mitigation Fails: The 2025 and 2026 Numbers
The performance data has not moved much in a decade. Wellingtone’s tenth State of Project Management report, released 16 March 2026, found that only 36% of organisations mostly or always complete projects on time, and that 72% of project professionals spend half a day or more a month collating reports. The full report adds a maturity checklist.
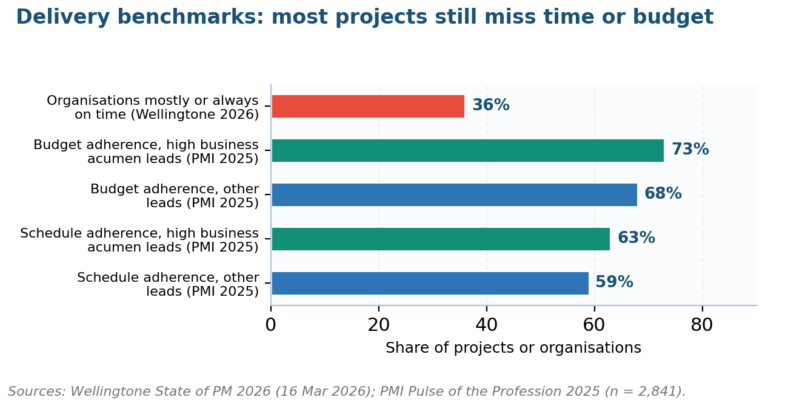
Figure 1. Wellingtone’s 2026 on-time figure sits far below PMI’s budget and schedule adherence rates, and PMI’s own split shows the lead’s skills move both.
PMI’s Pulse of the Profession 2025, based on 2,841 respondents, put budget adherence at 73% for projects led by people with high business acumen against 68% for everyone else, schedule adherence at 63% against 59%, and failure rates at 8% against 11%. The survey summary notes only 18% of professionals reach that proficiency level.
| Benchmark | Figure | Source and date | Mitigation lesson |
| Organisations mostly or always on time | 36% | Wellingtone, 16 March 2026 | Schedule risk needs its own analysis, not a cost-only register |
| Time spent collating reports | 72% spend half a day or more monthly | Wellingtone, 16 March 2026 | Automate the register so effort goes to responses |
| Budget adherence, high business acumen leads | 73% vs 68% | PMI Pulse, April 2025 | Train the lead in cost and contract reading, not only in tools |
| Project failure rate by lead skill | 8% vs 11% | PMI Pulse, April 2025 | The lead’s judgement is itself a mitigation |
| NNSA cumulative overrun growth | $2.1bn to $4.8bn in two years | GAO, 26 February 2026 | Contractor oversight is a risk, not an assumption |
| NASA cumulative overrun | $4.4bn to nearly $4.7bn; Orion about 75% of it | GAO, 23 July 2026 | Concentration in one project hides the rest of the portfolio |
The NASA figure shows the concentration problem. GAO’s July 2026 assessment of 36 major projects found the Orion crew capsule alone accounted for almost 75% of cumulative overruns, about $3.5 billion. A portfolio view that averages Orion with on-track projects reports a healthy mean while one programme absorbs the reserve, so mitigation has to be scored per project.
The 10 Project Risk Mitigation Strategies at a Glance
The table below is the whole article in one page. Each strategy has a named artefact, a metric that proves it is working, and the step in the nine-step project risk process it belongs to. Read down the artefact column: if your project cannot produce those documents on request, the corresponding strategy is not running.
| Strategy | Artefact it produces | Metric that proves it works | Process step |
| 1. Identify early and widely | Risk register with source, cause, event, effect | Risks logged before design freeze vs after | Identification |
| 2. Assign one owner per risk | Owner column with named people, not roles | Share of open risks with a named owner (target 100%) | Ownership |
| 3. Quantify, do not just rank | Probability, cost impact, schedule impact, expected value | Expected monetary value of the top ten | Analysis |
| 4. Size reserves by estimate class | Contingency and management reserve with release rules | Reserve drawdown against risk retirement | Planning |
| 5. Transfer through the contract | Risk allocation matrix, insurance schedule, bonds | Share of high-impact risks with a contractual holder | Response |
| 6. Monitor with triggers | Trigger and threshold per risk, dated | Triggers tripped vs responses started within the window | Monitoring |
| 7. Communicate on a rhythm | Risk section in every status report, top-five slide | Days since sponsor last saw the top five | Communication |
| 8. Escalate on written rules | Escalation matrix tied to impact bands | Escalations made vs criteria met | Escalation |
| 9. Review at gates | Gate checklist with risk retirement sign-off | Risks closed per gate; new risks per gate | Review |
| 10. Capture lessons into the next register | Lessons log mapped to register entries | Recurrence of last project’s top risks | Closure |
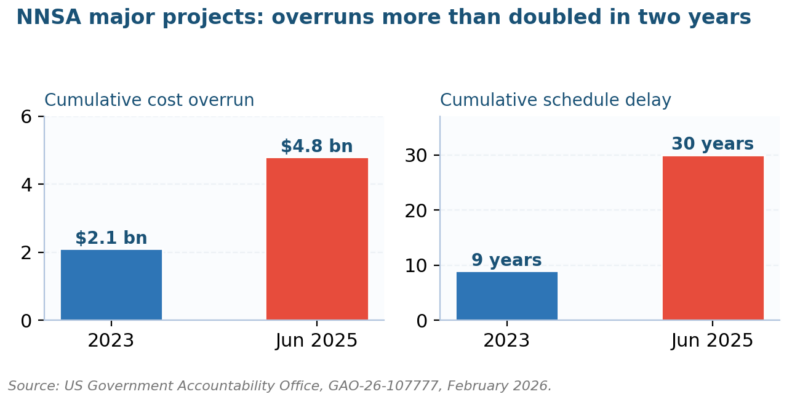
Figure 2. GAO’s 2026 NNSA assessment: the cost overrun more than doubled and the schedule delay more than tripled between 2023 and June 2025.
Strategies 1 to 5: Identify, Own, Quantify, Reserve, Transfer
1. Identify early and widely
Most costly risks are known at the start and logged late, as our guide to how to identify risks argues. GAO found seven other NNSA projects with overruns above 20% of baseline, driven by contractor management, vendor performance, and material prices. Run it before design freeze, using a checklist plus bow-tie analysis, and record cause, event, and effect separately.
2. Assign one owner per risk
A risk owned by a department is owned by nobody. Put a named person in the owner column, give them the response budget, and show days since their last update. The key elements of a risk register article sets out the columns; the owner column is the one auditors check first and teams leave blank.
3. Quantify, do not just rank
For every red and amber risk, add a probability, a cost range, and a schedule range, then compute expected value; a 5×5 matrix alone cannot tell a sponsor how much reserve to hold. Our risk matrix template in Excel carries those columns, and the guide to conducting risk analysis covers three-point estimates for teams new to it.
4. Size reserves by estimate class
Contingency should track how well the scope is defined. The National Academy of Construction’s contingency insight, following AACE’s classification practice, gives expected accuracy of -30/+50% at Class 5 (0 to 2% defined) narrowing to -5/+10% at Class 1 (50 to 100% defined). A flat 10% reserve is too small early and wasteful late.
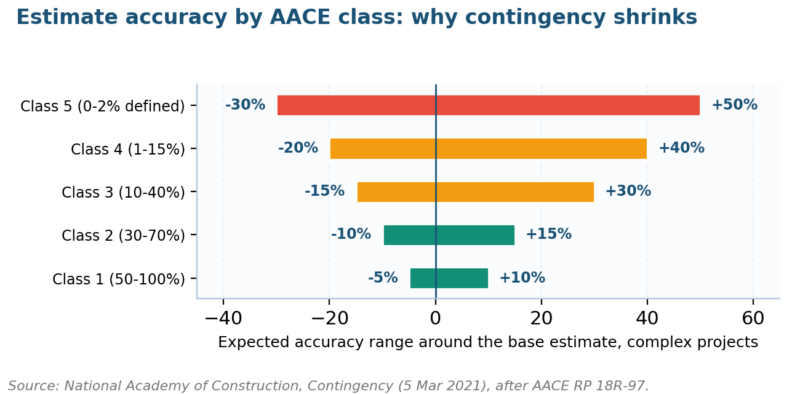
Figure 3. Accuracy ranges by AACE estimate class for complex projects; contingency should be set from the range for the class.
| AACE class | Definition level | Accuracy range (complex) | Typical use | Reserve approach |
| Class 5 | 0 to 2% | -30% to +50% | Concept screening | Parametric range, no line items |
| Class 4 | 1 to 15% | -20% to +40% | Feasibility | Parametric plus key event risks |
| Class 3 | 10 to 40% | -15% to +30% | Budget authorisation | Quantitative risk analysis, P50 to P80 |
| Class 2 | 30 to 70% | -10% to +15% | Control or bid | Hybrid parametric and CPM |
| Class 1 | 50 to 100% | -5% to +10% | Check estimate | Residual event risks only |
Keep contingency and management reserve separate. AACE’s RP 119R-21 derives contingency from parametric risk models for systemic risks, while management reserve covers scope changes the team could not foresee and belongs to the owner. Schedule contingency follows RP 70R-12 and is held in time, with Washington State’s range-estimating guidance showing the public-sector version.
5. Transfer through the contract
In August 2026 Hill International projected Honolulu’s Skyline at $10.19 billion, above the $10.079 billion budget, driven by design changes on a city-center segment let for $1.66 billion in 2024. Transfer only works when the receiver can bear the risk, and a fixed price on an immature design transfers little, so risk transfer needs a mature scope first.
Strategies 6 to 10: Monitor, Communicate, Escalate, Review, Learn
6. Monitor with triggers
Each open risk needs a trigger and a threshold. Intel’s Ohio One campus, promised for 2025, was pushed to 2030 on 28 February 2025, and Axios reported the company tied the slip to demand and capital discipline. A supplier on that programme needed a trigger on Intel’s capital guidance months earlier, of the kind our key risk indicator examples list.
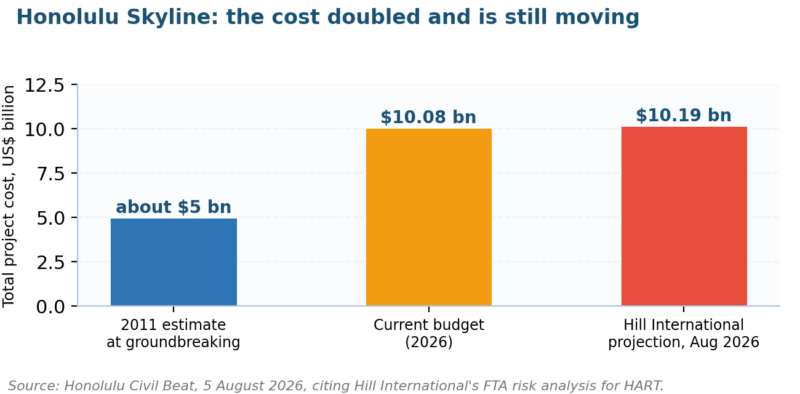
Figure 4. Honolulu Skyline: the 2011 estimate doubled by 2026, and the August 2026 risk analysis still adds $111 million.
7. Communicate on a rhythm
In February 2026 HART’s chief executive told Civil Beat in February 2026 that the schedule carried no float, which is the kind of sentence a sponsor needs in writing. Sponsors do not read registers; they read the top five. Put a fixed risk slide in every status pack and log the date the sponsor last saw it.
8. Escalate on written rules
Before the first crisis, write the escalation matrix and tie it to impact bands from the risk appetite statement: expected cost above one share of contingency goes to the sponsor within set days, above a second band to the steering committee. Escalation that depends on who is nervous that week is not a control.
9. Review at gates
Each stage gate should close risks as well as approve spend. GAO’s Schedule Assessment Guide ties credible cost estimates to schedule risk analysis, so a gate that approves a budget without a fresh schedule risk run approves an untested number. Count risks retired and added per gate; a rising count late in design is the first warning of a rebaseline.
10. Capture lessons into the next register
Nobody reopens most lessons-learned documents, so they mitigate nothing. Map each lesson to a register entry template so the next project starts with the last project’s top ten pre-loaded and pre-scored. Our software project risk management guide shows how a delivery organisation turns closed projects into a starter register, and the mitigation plan checklist lists what the entry should carry.
A Worked Example: Ten Strategies on a Rail Segment
The table applies the ten strategies to a generic three-mile elevated rail segment with six stations, modelled on the scale of Honolulu’s city-center contract but not describing it. The base estimate is $1.5 billion at Class 3, so the accuracy range is -15% to +30% and the quantified reserve is set at P70, about $210 million.
| Strategy applied | Register entry or artefact | Quantified figure | Owner and trigger |
| Identify | Utility relocation conflicts along 3 miles of guideway | P 60%, cost $40m to $90m, 4 to 9 months | Design lead; trigger: utility survey returns above 20 unresolved conflicts |
| Own and quantify | Systems integration between signalling and platform doors | P 45%, cost $25m to $70m, 6 to 12 months | Systems manager; trigger: factory acceptance test slips 30 days |
| Reserve | Contingency at P70 on the Class 3 range | $210m held; released in $10m tranches against retired risks | Project controls; trigger: drawdown above 50% before 40% progress |
| Transfer | Geotechnical risk on 40 pier foundations | Contractor holds ground risk to a defined baseline; owner holds beyond | Commercial lead; trigger: two borehole variances above baseline |
| Monitor and escalate | Vendor delivery of 24 escalators | Expected value $6m; escalate above $15m | Procurement; trigger: vendor capacity notice or 45-day slip |
| Review and learn | Gate 3 closes 14 risks, opens 6 | Net retirement 8; reserve reduced by $35m | PMO; lessons mapped to next segment’s register |
Two figures in that table do the most work. The reserve release rule stops contingency being spent on scope creep, and the net retirement count tells the sponsor whether risk is leaving the project. Both are cheap to report and missing from most status packs we review, and the energy project risk assessment applies the same shape.
Common Project Risk Mitigation Questions Practitioners Ask
What is project risk mitigation, and how is it different from risk management?
Project risk mitigation is the subset of risk management that acts on identified threats to reduce their probability or impact before they occur. Risk management also covers identification, analysis, acceptance, transfer, and monitoring. In PMBOK terms, mitigate is one of five threat responses alongside escalate, avoid, transfer, and accept.
Which project risk mitigation strategy should come first?
Identification comes first because every later strategy in project risk management depends on a complete register. Run the workshop before design freeze, log causes and effects separately, and pre-load the register with the previous project’s top risks. GAO’s NNSA findings show the costliest risks were known categories that were logged and managed late.
How much contingency does project risk mitigation need?
Set contingency from the estimate class; a flat percentage ignores how well the scope is defined. AACE-derived ranges for complex projects run from -30/+50% at Class 5 to -5/+10% at Class 1, and a quantitative risk analysis at Class 3 typically funds a P50 to P80 outcome. Keep management reserve separate, owned by the sponsor, for unforeseen scope changes.
Who owns project risk mitigation on a project?
The project manager owns the process; each risk has one named owner who holds the response budget and updates the entry. The sponsor owns escalated risks and the management reserve. A register where the owner column shows departments or roles rather than people is the most common sign that mitigation is not being done.
How does project risk mitigation handle contractual transfer?
Transfer moves the financial impact to a party better placed to bear it, through insurance, bonds, warranties, or fixed-price terms, but it only works when the scope is mature enough to price. Honolulu’s $1.66 billion city-center contract still left the owner exposed to design changes that pushed the projected total to $10.19 billion by August 2026.
What metrics show project risk mitigation is working?
Track five: share of open risks with a named owner, expected monetary value of the top ten, reserve drawdown against risks retired, triggers tripped against responses started on time, and net risk retirement per gate. Wellingtone’s 2026 finding that 72% of professionals spend half a day or more monthly on reporting argues for automating all five.
Seven Traps That Derail Mitigation Programs
| Pitfall | Root cause | Remedy |
| Register built once, never updated | No owner column, no update date, no gate review | Days-since-update field; gate sign-off requires a refreshed register |
| Flat 10% contingency at every stage | Reserve set by habit rather than estimate class | Set from the AACE range for the class; re-run at each gate |
| Reserve spent on scope creep | No release rule tied to risk retirement | Tranche releases only against closed risks; scope changes go to management reserve |
| Fixed-price contract on an immature design | Transfer attempted before Class 3 definition | Mature scope first; allocate ground and design risk explicitly |
| Escalation by mood | No impact bands in the appetite statement | Escalation matrix with dollar and day thresholds, published before mobilisation |
| Portfolio averages hide one failing project | Reporting at programme level only | Score and report per project; flag any project above 20% overrun |
| Lessons filed, never reused | Lessons log not mapped to register templates | Pre-load the next register with the last project’s top ten |
Where the Profession Is Heading
Federal oversight is tightening around the numbers in this article. GAO’s biennial NNSA assessments and its annual NASA reviews now publish cumulative overrun and delay figures per project, and eight of GAO’s 21 prior NNSA recommendations were still open in December 2025. Expect sponsors on public projects to ask for the same per-project scoring from contractors.
In November 2022 AACE revised RP 119R-21 to give small projects a tabular route to risk-based contingency, which moves quantification from optional to expected. Deloitte’s 2026 engineering and construction outlook flags tariff-driven material volatility and data-centre demand as the pressures that will test reserves set in 2024 and 2025.
Reporting load is the constraint to design around. With 72% of professionals spending half a day or more each month collating reports, the register has to feed the status pack automatically or the monitoring strategy collapses under its own paperwork. Choose tooling that computes expected value and drawdown, and keep the risk log and the risk register as separate documents.
If you sponsor or deliver capital projects and want the ten strategies installed as a working register, reserve rules, and an escalation matrix your board will sign, look through our services and then contact us to book a register review ahead of your next gate.

Chris Ekai is a Risk Management expert with over 10 years of experience in the field. He has a Master’s(MSc) degree in Risk Management from University of Portsmouth and is a CPA and Finance professional. He currently works as a Content Manager at Risk Publishing, writing about Enterprise Risk Management, Business Continuity Management and Project Management.