
To mitigate risk in business, identify and assess your top exposures, then apply one of four strategies to each. Avoid the activity, reduce the likelihood or impact with controls, transfer the exposure through insurance or contracts, or accept it with a documented contingency plan. Review the plan quarterly against live indicators.
In May 2025, General Motors cut its full-year guidance and told investors that new US import tariffs would cost it $4 billion to $5 billion. The final 2025 bill came in at $3.1 billion, and the difference was not luck.
CFO Paul Jacobson told analysts the company offset 40 percent of the gross hit. The offsets came from moving production into US plants, cutting up to $2 billion in costs, and holding the pricing line. That’s risk mitigation working in public, at industrial scale, and the cleanest recent proof that a plan to mitigate risk can move a number the CFO reports.
| Mitigate Risk in Business: Key Takeaways |
| General Motors absorbed a $3.1 billion gross tariff cost in 2025 yet offset 40 percent of it through production shifts, cost cuts, and pricing discipline, per CFO Paul Jacobson. |
| Four strategies to mitigate risk cover every exposure: avoid the activity, reduce likelihood or impact, transfer through insurance or contracts, or accept with a documented contingency. |
| Travelers’ 2025 Risk Index found 58 percent of 1,202 US business decision-makers worried about economic uncertainty and medical costs; 56 percent about cyber threats. |
| Commercial insurance rates fell 6 percent globally in Q2 2026, the eighth straight quarterly decline per Marsh, making risk transfer unusually cheap to buy. |
| Only 24 percent of organizations spend significantly more on proactive controls than on reaction, according to PwC’s 2026 Global Digital Trust Insights survey. |
| Review mitigation quarterly against key risk indicators; ISO 31000 and COSO ERM both treat monitoring as a standing duty, never an annual formality. |
Most businesses will never book a tariff line that size, but the method to mitigate risk scales down cleanly. Four strategies, one plan connecting them, a short list of tools, and the 2026 market numbers give any owner enough to run the same play at their own scale. The starting point is the next mitigation review.
What It Takes to Mitigate Risk in Business
Risk mitigation is the set of deliberate actions that reduce either the probability of a threat occurring or the damage it causes when it does. ISO 31000, the international risk management standard, files these actions under risk treatment, one step in a loop that starts with identification and never really ends.
The work to mitigate risk begins with a structured risk assessment that inventories what could hurt you. Businesses typically group exposures into financial, operational, strategic, and compliance categories, and each category tends to reward a different mix of treatments, as the table below shows.
| Risk type | Typical exposures | Primary treatment mix | Example control |
| Financial | Tariffs, FX swings, credit defaults, interest rates | Reduce and transfer | Hedging, diversified suppliers, credit insurance |
| Operational | Equipment failure, injuries, cyber intrusion, outages | Reduce, then transfer | Maintenance programs, safety training, MFA, backups |
| Strategic | New competitors, demand shifts, failed expansion | Avoid or accept | Stage-gated investment, market pilots before scale-up |
| Compliance | New regulation, license breaches, reporting failures | Reduce | Compliance calendar, monitoring, counsel review |
| Reputational | Product recalls, data breaches, public disputes | Reduce and prepare | Quality checks, response playbooks, media protocols |
Treatment changes the math, and the COSO ERM framework insists you measure it. Score every exposure twice: once before controls and once after, so the gap between inherent and residual risk shows exactly what your program to mitigate risk buys you each quarter.
The residual score then gets compared against a written risk appetite statement that says how much exposure the business will carry. Anything sitting above appetite needs more treatment; anything far below it may be over-controlled, quietly tying up money that stronger mitigation elsewhere could use.
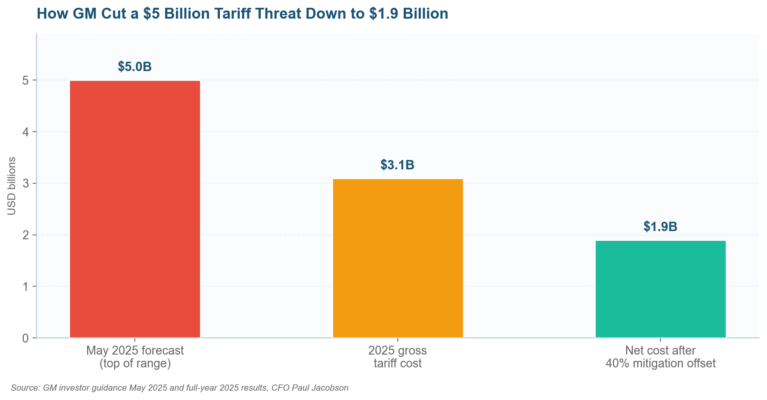
Figure 1. GM’s 2025 tariff exposure: forecast, gross outcome, and net cost after a 40 percent mitigation offset.
Why the 2026 Threat Picture Leaves No Slack
GM’s numbers explain the method; the survey data explains the urgency. The Travelers Risk Index drew on 1,202 US business insurance decision-makers surveyed by Hart Research. It found 58 percent worrying some or a great deal about broad economic uncertainty and rising medical costs alike.
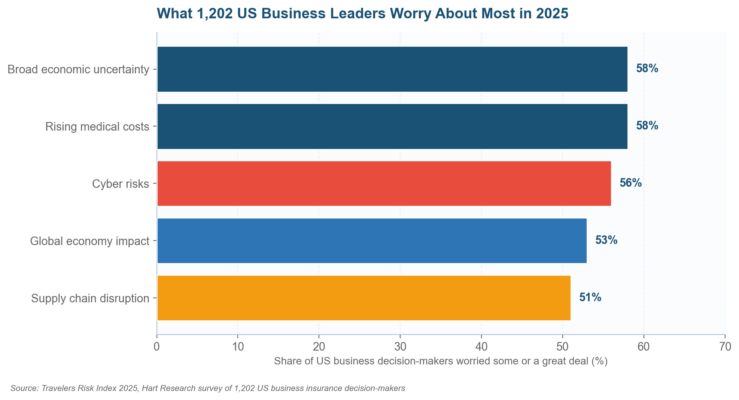
Figure 2. Economic uncertainty, medical costs, and cyber threats lead the 2025 Travelers Risk Index of exposures to mitigate.
Cyber sits right behind at 56 percent, and the detail under that headline is what a plan to mitigate risk has to absorb in practice. The same survey breaks the worry into five specific scenarios, each one worth testing against the controls your business runs today:
- Security breaches and hacker intrusion: 56 percent of leaders concerned
- Unauthorized access to financial accounts: 55 percent
- Theft or compromise of client records: 53 percent
- Breaches arriving through a vendor’s systems: 53 percent
- Cyber extortion and ransomware: 53 percent
Boardroom confidence tells the same story from the top. PwC’s 2026 Global CEO Survey found only 30 percent of chief executives confident about revenue growth over the next twelve months. Confidence is down from 38 percent in 2025 and 56 percent in 2022, and 31 percent of CEOs now rank cyber as a major threat.
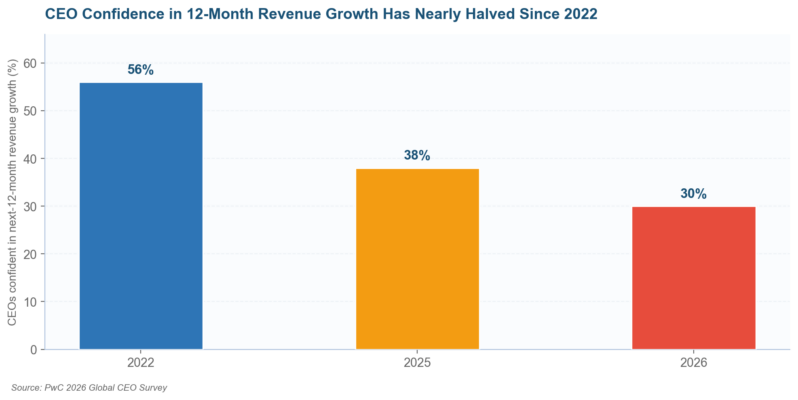
Figure 3. CEO confidence in near-term revenue growth has nearly halved since 2022, per PwC.
Yet spending hasn’t caught up with sentiment. PwC’s 2026 Global Digital Trust Insights survey of 3,887 executives found just 24 percent of organizations spending significantly more on proactive measures than reactive ones. That gap between worry and preparation is exactly why risk management matters commercially, and it is the gap this article closes.
The Four Risk Mitigation Strategies, Compared
Every treatment decision you’ll ever make to mitigate risk reduces to four moves. The exposure can be a tariff, a ransomware gang, or a single customer holding 40 percent of revenue; the moves stay the same. Seasoned teams pick deliberately among them; struggling teams default to one and call it a risk response.
| Strategy | What it does | Best fit | Cost profile |
| Avoid | Eliminates the exposure by declining or exiting the activity | Impact would exceed appetite and no control closes the gap | Lost upside, zero residual risk |
| Reduce | Cuts likelihood or impact through controls, training, and design | Recurring risks where controls cost less than expected loss | Ongoing control spend |
| Transfer | Shifts financial consequences to an insurer or counterparty | Large, infrequent, insurable losses; contractable duties | Premiums plus retained deductible |
| Accept | Keeps the risk with documented rationale and a contingency | Small expected loss or mitigation costing more than the risk | Contingency reserve only |
Risk avoidance
Avoidance means the activity does not happen: the market entry is shelved, the supplier is dropped, the data is never collected. It is the only strategy that takes residual risk to zero, and it costs you every scrap of upside the activity would have produced.
Use it sparingly and honestly. A business that avoids everything stops growing, which is why avoidance decisions belong at the appetite level, made by owners or boards. Record them with the same rigor as the ten project mitigation moves on any well-run register.
Risk reduction
Reduction is the workhorse: controls that make the bad event rarer, smaller, or both. OSHA’s safety management guidance frames it as hazard prevention and control. The NIST Cybersecurity Framework gives the same logic to digital threats through its govern, identify, protect, detect, respond, and recover functions.
Small firms get disproportionate value here because the baseline controls that mitigate risk are cheap. The FTC’s small-business cybersecurity guidance and CISA’s best-practice library cover multi-factor authentication, patching, backups, and phishing training, the controls that blunt the ransomware scenarios most leaders told Travelers they fear.
Risk transfer
Transfer moves the financial consequence to someone priced to carry it: an insurer, a contractor holding an indemnity, a supplier bound to service levels. The exposure itself stays yours, so transfer always rides on top of reduction rather than replacing it; used alone, it does not mitigate risk, it only prices it.
Risk acceptance
Acceptance is a decision, never a shrug. It belongs in writing, with the expected loss quantified, the rationale recorded, and a trigger that reopens the file if conditions change. GM accepted the tariff exposure it could not offset, roughly $1.9 billion, and said so publicly.
Choosing among the four is where programs to mitigate risk succeed or stall, and the same argument tends to repeat itself risk by risk. Four decision rules settle most of those debates quickly, and they are worth writing into the risk policy itself:
- Avoid when worst-case impact exceeds appetite and no affordable control brings it inside
- Reduce when the annual cost of controls runs below the expected annual loss
- Transfer when the loss would be severe but rare, and an insurer or counterparty prices it fairly
- Accept when expected loss is immaterial, and document the threshold that would change the answer
Building the Plan, Step by Step
Strategies to mitigate risk only work inside a plan that assigns them. The sequence below follows the ISO 31000 loop and fits a business of any size. A five-person firm can run it in a spreadsheet, while GM runs it across a global manufacturing footprint.
| Step | Action | Working output |
| 1 | Identify exposures across finance, operations, strategy, and compliance | A populated risk register with named owners |
| 2 | Assess likelihood and impact, before and after existing controls | Scored register plus a plotted heat map |
| 3 | Prioritize against the written risk appetite | Ranked list of above-appetite exposures |
| 4 | Select a mitigation strategy per risk: avoid, reduce, transfer, or accept | Treatment decision recorded with rationale |
| 5 | Implement controls with one owner and one deadline each | Action log tied back to register entries |
| 6 | Monitor indicators and reassess on triggers, not calendars | KRI dashboard reviewed at least quarterly |
Steps one and two live in documents you may already have. A risk register holds the inventory, scores, owners, and treatment status, while a 5×5 heat map turns those scores into the one-page picture that boards and lenders actually read.
Severity scoring improves sharply once you know what an outage really costs. A business impact analysis, using a structured BIA template, quantifies lost revenue and recovery cost per day of disruption, which converts arguments about impact ratings into arithmetic.
For the risks you cannot prevent, continuity planning is how you mitigate risk. ISO 22301 defines the management-system standard, SBA’s emergency preparedness guidance covers the small-business basics, and a tested continuity plan template turns both into something staff can execute at 2 a.m.
Calendars alone can’t keep the plan current, because exposures move on their own schedule. Reopen the register between quarterly reviews whenever a trigger fires, and treat the following four as automatic reassessment events rather than judgment calls for the risk owner:
- A key risk indicator breaches its threshold for two consecutive periods
- A regulation, tariff, or contract change moves a scored exposure materially
- The business adds a market, product line, system, or critical supplier
- A near miss inside the firm, or a loss at a peer, reveals a scenario the register never modeled
Tools That Keep the Program Honest
None of these tools is exotic, and most start free. What separates programs that mitigate risk from shelfware is that each tool feeds the next. The register feeds the heat map, the BIA feeds the scores, and the indicators feed the review meeting.
| Tool | The job it does | Starting point |
| Risk register | Single inventory of exposures, scores, owners, and mitigation actions | Spreadsheet template, then software at scale |
| Risk matrix / heat map | Visual prioritization by likelihood and impact | 5×5 Excel grid |
| Key risk indicators | Early warning that likelihood or impact is shifting | 3 to 5 metrics per top risk |
| Business impact analysis | Quantifies disruption cost per process per day | Ready.gov worksheet or BIA template |
| Scenario analysis | Stress-tests strategy risks and compounding events | IEC 31010 technique library |
| Audits and control testing | Independent proof that controls operate as designed | Annual internal audit cycle |
Indicators deserve the most care because they are the difference between monitoring and hoping. Good key risk indicator examples are leading rather than lagging: days of buffer stock, patch latency, overdue control tests, single-customer revenue share, each with a threshold that forces a conversation.
Technique selection has its own standard as well. IEC 31010 catalogs dozens of assessment methods from bow-tie analysis to Monte Carlo simulation. Dedicated ERM platforms automate the register, workflow, and reporting once spreadsheet friction starts eating the time your mitigation reviews need.
Where Insurance Fits in a Softening Market
Risk transfer is having its cheapest moment in years. Marsh’s Global Insurance Market Index recorded a 6 percent average drop in global commercial rates in Q2 2026, the eighth consecutive quarterly decline. Property fell 12 percent on abundant capacity and insurer competition.
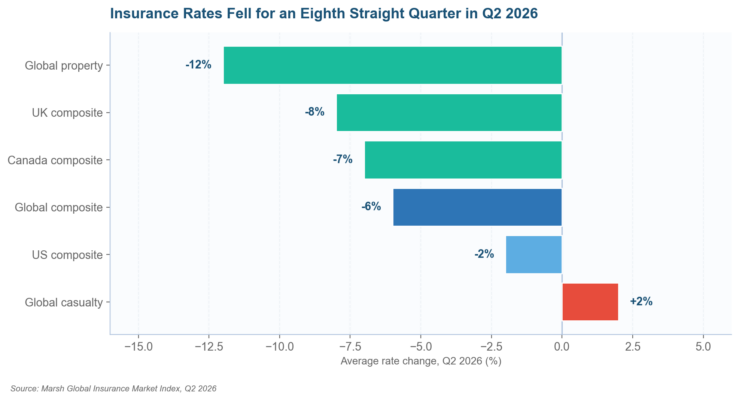
Figure 4. Q2 2026 rate movement by line and region: property fell 12 percent while US casualty kept rising.
The exception matters as much as the trend does. US casualty rates rose about 2 percent in the same quarter, driven by litigation severity. Liability-heavy businesses shouldn’t expect the soft market to rescue that line and should budget to mitigate risk on that line accordingly.
| Line | Q2 2026 move | What a buyer should do |
| Property | Down 12 percent | Revisit limits and sub-limits cut during the hard market; buy back flood or wind if exposed |
| Global composite | Down 6 percent | Rebroke the whole program; loyalty has a price when capacity is abundant |
| US composite | Down 2 percent | Push retention analysis; modest savings fund higher limits |
| US casualty | Up 2 percent | Pair coverage with loss-control evidence to fight the increase |
Transfer also runs through contracts, not just policies. Indemnities, liability caps, and service-level commitments push exposure onto the parties best placed to control it. That’s why a current third-party risk framework belongs beside the insurance schedule in any mitigation file.
Bring evidence to renewal and the soft market compounds in your favor, because underwriters price documented efforts to mitigate risk the way lenders price collateral. Four documents consistently move quotes, and none of them takes longer than a quarter to assemble once the program is running:
- Three to five years of loss runs with corrective actions noted against each claim
- Control evidence: inspection records, training logs, and cyber posture assessments
- Business continuity plan test results with dates and findings
- A retention analysis showing which deductibles the balance sheet can absorb
Frequently Asked Questions About Risk Mitigation
What is the first step to mitigate risk in business?
Start with a structured risk assessment: list every material exposure, score each for likelihood and impact, and rank them against your risk appetite. Nothing downstream works without that inventory. GM could only offset 40 percent of its tariff bill because it had already mapped which plants, parts, and prices the exposure touched.
Which risk mitigation strategy costs the least for a small business?
Risk acceptance costs the least up front: document the exposure, set the threshold that would change the decision, and hold a small contingency reserve. It only stays a cheap way to mitigate risk while expected losses stay small. For hazards that could close the business, pair acceptance with low-cost mitigation controls from the FTC’s small-business cyber guidance.
How often should a risk mitigation plan be reviewed?
Review the full plan to mitigate risk every quarter, and reassess any single risk the moment a key risk indicator breaches its threshold. ISO 31000 treats monitoring as a continuous duty rather than an annual event. Tariff policy in 2025 moved faster than any yearly cycle could catch, which is why GM re-forecast midyear.
Does buying insurance count as risk mitigation?
Yes: insurance is risk transfer, one of the four core strategies to mitigate risk, and it converts an unpredictable large loss into a predictable premium. It never removes the underlying exposure, so boards still expect reduction controls beside it. With commercial rates down 6 percent in Q2 2026, transfer is unusually affordable.
How do you measure whether risk mitigation is working?
Track residual risk against appetite using key risk indicators: incident counts, near misses, control test failures, and loss values. A working program shows residual scores trending toward target while indicators hold inside thresholds. GM measured its program in dollars, reporting a 40 percent offset against a $3.1 billion gross exposure.
What is the difference between risk mitigation and risk management?
Risk management is the whole lifecycle: identify, assess, treat, monitor, and communicate, as ISO 31000 frames it. Risk mitigation is the treatment slice, the specific actions that cut likelihood or impact. Every choice to mitigate risk happens inside the wider management process, and the register with its reviews connects the two.
What Goes Wrong, and the Fixes That Work
Most failures to mitigate risk are process failures rather than analysis failures: the risk was on the register, the treatment was named, and then nobody moved. The table collects the six breakdowns we see most in crisis post-mortems, each with its working repair.
| Pitfall | Root cause | Fix that works |
| Plan written once, then shelved | Annual-review culture | Quarterly reviews plus KRI triggers that force off-cycle reassessment |
| Every risk defaults to ‘reduce’ | No documented appetite | Match strategy to appetite; accept small exposures in writing |
| Insurance treated as the whole answer | Transfer confused with elimination | Pair every policy with reduction controls and a retention analysis |
| Controls with no owner or deadline | Register lists risks, never actions | One named owner and one dated milestone per mitigation action |
| Budget flows to cleanup, never prevention | Reactive spending habit; only 24 percent tilt proactive per PwC | Shift spend toward monitoring, testing, and training |
| Register stops at the company’s front door | First-party bias | Score critical suppliers and vendors with the same rigor |
The Road Into 2027
Trade policy will keep testing programs that mitigate risk before anything else does. GM has already told investors to expect a further $2.5 billion to $3.5 billion tariff cost in 2026. Businesses that build sourcing flexibility now will price that volatility instead of absorbing it.
The proactive-spending gap is the opening competitors will leave you. Only 24 percent of organizations out-spend their reactive budgets on prevention. A firm that funds monitoring, control testing, and training buys cheaper losses and, increasingly, cheaper capital as lenders read COSO-aligned programs as creditworthiness.
The soft insurance market won’t run forever; eight quarters of decline is already a long cycle by historical measure. Lock in multi-year terms where carriers offer them, spend part of the savings on higher limits, and document control evidence while underwriters are still rewarding it.
To mitigate risk in business, start with one register, four strategies, and a quarterly review, then let ISO 31000 discipline the loop. If you want a program built to that standard, from register to board report, review our services and contact us. The next tariff, breach, or outage won’t wait for your annual planning cycle.

Chris Ekai is a Risk Management expert with over 10 years of experience in the field. He has a Master’s(MSc) degree in Risk Management from University of Portsmouth and is a CPA and Finance professional. He currently works as a Content Manager at Risk Publishing, writing about Enterprise Risk Management, Business Continuity Management and Project Management.