Risk management adds value by protecting what an organization already owns and enabling the risks worth taking. Eight mechanisms carry that value: better decisions, avoided losses, business continuity, operational efficiency, stakeholder confidence, competitive advantage, legal compliance, and cheaper capital. ISO 31000 names value creation and protection as its first principle for exactly this reason.
Between August 2023 and August 2024, US Department of Agriculture inspectors logged 69 violations at Boar’s Head’s Jarratt, Virginia plant: black mold, insects, blood pooling on the floor. Every one of those reports was an unpriced risk sitting in plain sight. Nobody escalated them into a decision.
The bill arrived in July 2024. Listeria traced to the plant killed 10 people and hospitalized dozens across 19 states, according to the CDC’s outbreak investigation, and the company recalled more than 7 million pounds of ready-to-eat meat. By September, Boar’s Head had closed the plant indefinitely.
| Risk Management Adds Value: Key Takeaways |
| Risk management adds value through eight mechanisms: sharper decisions, avoided losses, continuity, efficiency, stakeholder confidence, competitive advantage, compliance, and cheaper capital. |
| The cost of absence is measurable. Boar’s Head recalled over 7 million pounds of product in 2024 after inspectors had logged 69 violations; 10 people died and the plant closed. |
| Controls pay for themselves in the data: IBM’s 2025 report puts the average US breach at a record $10.22 million, while faster detection cut the global average 9% to $4.44 million. |
| PwC’s Global Risk Survey found only the top 5% of organizations, its Risk Pioneers, treat risk as an engine of opportunity, and they grow revenue faster than the rest. |
| ISO 31000 makes the point structurally: value creation and protection is the standard’s first principle, the reason the process exists at all. |
| Half of risk leaders now expect a turbulent world, up 14 points in one year (WEF Global Risks Report 2026), which raises the price of having no program. |
A functioning risk program costs a fraction of one such event, and that asymmetry is the whole argument for funding one properly. The USDA’s own investigation found inadequate sanitation practices contributed directly. The sections below trace where the value comes from, the evidence behind it, and how to prove it to a board.
Where Risk Management Adds Value First
Start with the standard that governs the discipline. ISO 31000 opens its principles with value creation and protection, and COSO’s ERM framework carries the same idea in its subtitle, integrating risk with strategy and performance. Our ISO 31000 guide walks through the full principle set.
Eight mechanisms do the practical work. Each one converts uncertainty into something an executive can budget for, and each one eventually shows up somewhere specific in the financial statements. The table maps every mechanism to the line where the money actually appears.
| Mechanism | How the value is created | Where it shows up |
| Better decisions | Risks priced before commitments are made | Fewer write-offs and abandoned projects |
| Avoided losses | Controls catch failures before they compound | Lower incident and remediation costs |
| Business continuity | Critical operations recover on a tested plan | Revenue protected through disruption |
| Operational efficiency | Root causes fixed instead of symptoms | Lower cost of quality and rework |
| Stakeholder confidence | Investors, customers, and regulators see discipline | Retention, loyalty, lighter scrutiny |
| Competitive advantage | Faster, safer moves than unprepared rivals | Market share taken during turbulence |
| Legal compliance | Obligations mapped and monitored | Penalties and sanctions avoided |
| Cheaper capital | Lenders and insurers price observed discipline | Lower premiums and borrowing costs |
The list deliberately mirrors the strengths and weaknesses ledger in our advantages and disadvantages of risk management analysis, which weighs the same mechanisms against their costs. That ledger answers whether the program is worth buying; the sections below show how each mechanism gets built.
The Evidence That the Value Is Real
Cyber risk offers the cleanest measurement of controls paying for themselves, because breach costs are tracked annually across hundreds of companies. IBM’s Cost of a Data Breach Report 2025, covering 600+ breached organizations, puts the US average at a record $10.22 million per incident.
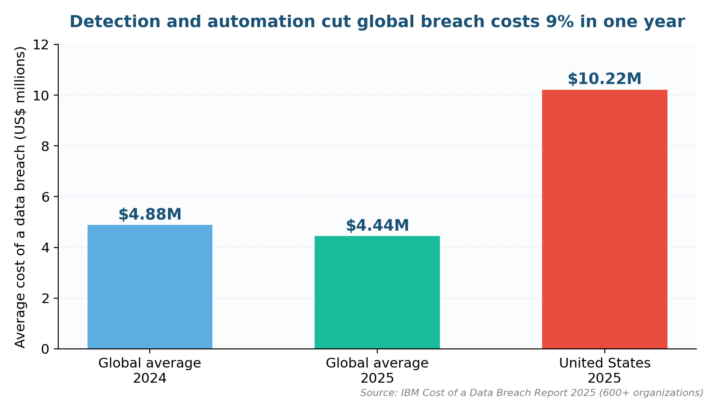
Figure 1. The global average breach cost fell 9% to $4.44 million in 2025, driven by faster detection and automation (IBM).
Read the direction of the numbers, because it carries the argument. The global average fell 9% in one year, and IBM attributes the drop to faster detection and containment through security AI and automation. Those are risk controls, and their effect is visible in nine figures of avoided cost across the sample. For the case that comes before the mechanisms, start with why risk management is important in the first place.
Survey evidence points the same way at program level. PwC’s Global Risk Survey identified a top 5% of organizations, its Risk Pioneers, that treat risk as an opportunity engine. They report revenue growth ahead of the survey average and lean harder on analytics, predictive modeling, and upskilled risk teams.
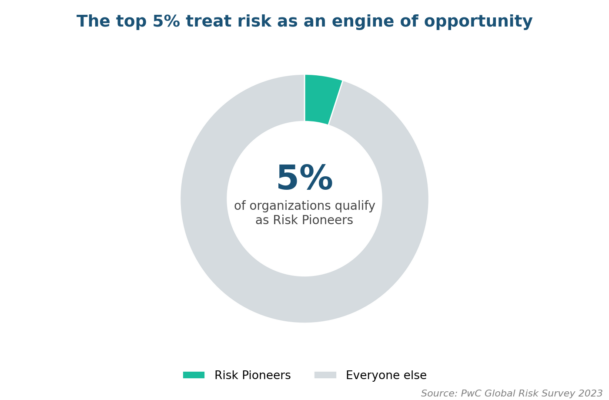
Figure 2. Only 5% of surveyed organizations qualify as Risk Pioneers, and they outgrow the rest (PwC Global Risk Survey).
The pattern in both datasets is the same asymmetry the Boar’s Head case shows in reverse. Controls cost thousands and compound quietly; uncontrolled events cost millions and arrive all at once. Our library of risk management examples documents that asymmetry across a dozen more sectors.
Better Decisions with Priced Risk
Decision quality is the first mechanism because every other mechanism depends on it. A decision made with priced risk allocates capital toward exposures the organization understands and away from ones it cannot absorb. A decision made without it is a guess wearing a business case.
Pricing starts with quantification. Quantitative techniques turn a vague concern into an expected value the CFO can compare against a control budget. The strategic-versus-operational split then routes each priced risk to the specific executive who owns that class of decision.
The reference point for every decision is a written risk appetite. Appetite converts value from an abstraction into a rule: this deal is inside the band, that one needs board sign-off. Companies with no stated appetite discover their real one only after a loss defines it for them.
How Risk Management Adds Value Step by Step
Each stage of the risk management lifecycle produces its own distinct value, which is why gutting any single stage weakens the return on the whole program. The loop runs identify, assess, respond, monitor, and the table names what each step earns.
| Process step | Value produced | Value lost if skipped |
| Identify | Exposures surface while options are still cheap | Surprises priced at crisis rates |
| Assess | Ranked register focuses money on what matters | Budget spread thin across trivia |
| Respond | Avoid, transfer, mitigate, or accept, on purpose | Every risk accepted by default |
| Monitor | Early-warning metrics buy reaction time | Stale register, false assurance |
A worked example shows the arithmetic. Suppose assessment flags a supplier concentration with a 20% chance of a $2 million disruption, an expected exposure of $400,000, against a $60,000 cost to qualify a second supplier. The response decision clears in one meeting, because both numbers sit in the same currency.
Monitoring then keeps the value from decaying. A small set of key risk indicators (KRIs), each an early-warning metric tied to a specific exposure, tells the team when likelihood is climbing before the loss lands. The five essential steps article details the cadence that keeps the loop honest.
Continuity, Reputation, and the Cost of Absence
Continuity value is invisible until the day it is the only value that matters. A tested business continuity plan built on a proper business impact analysis keeps revenue flowing through a disruption that idles unprepared competitors. The premium for that resilience is paid in planning hours, not crisis dollars.
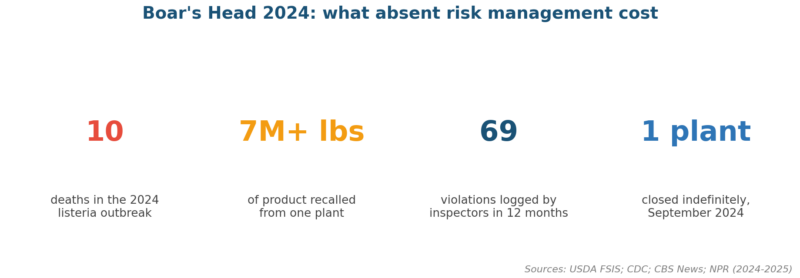
Figure 3. The 2024 Boar’s Head outbreak in four numbers: the cost of 69 unescalated warnings (USDA FSIS, CDC, CBS, NPR).
Reputation compounds the operational loss. Boar’s Head was a 119-year-old brand whose name carried a price premium in the deli case; one plant’s sanitation failures put that premium in the headlines for months. The company reopened the facility in 2025 under a new food-safety regime, rebuilding what oversight would have preserved.
Regulators price absence too. OSHA’s penalty schedule now tops $165,000 per willful or repeated violation, and a documented compliance management program is the difference between a corrected finding and a willful citation. Confidence from regulators behaves like confidence from customers: cheap to keep, expensive to win back.
Measuring the Value So the Board Believes It
The hardest question in the discipline is the one boards actually ask: prove it. Value that arrives as an absence, the fine not paid, the outage not suffered, does not appear in any ledger. It has to be measured deliberately, and our guide to measuring risk management builds the full method.
Five metrics carry most of the proof, and none of them requires new software or a consulting engagement. Together they convert the invisible absence of loss into a set of numbers that a finance committee can trend, challenge, and eventually defend at budget time:
- Loss trend: total incident costs per quarter, tracked against the three-year baseline.
- Near-miss ratio: events caught by controls versus events that landed, trending up as detection improves.
- Total cost of risk: premiums, retained losses, and control spend as a share of revenue.
- Priced decisions: the share of major commitments that carried a quantified risk assessment.
- Audit closure: open findings and their aging, the regulator’s own confidence measure.
Insurance is the external audit of the numbers. Underwriters reprice observed discipline every renewal, and a falling total cost of risk while coverage holds is third-party evidence the program works. The three lines of defense model gives the board independent assurance that the metrics themselves are honest.
Adapting When the Market Moves
The environment now repays adaptability faster than ever. In the WEF Global Risks Report 2026, geoeconomic confrontation ranks as the top two-year risk, and half of surveyed leaders expect a turbulent world, up 14 points in a single year.
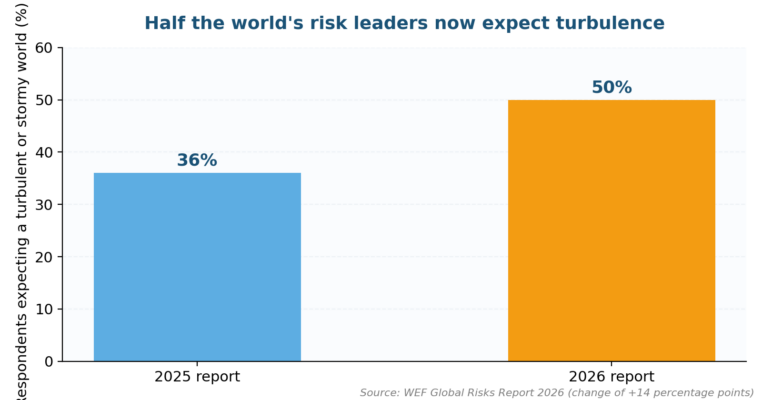
Figure 4. Turbulence expectations jumped 14 points in one year (WEF Global Risks Report 2026).
Turbulence is where the competitive-advantage mechanism cashes out. CNBC’s read of the report highlights tariffs and AI disruption as the near-term drivers, and firms with a live register can reprice suppliers, contracts, and hedges in days. Firms without one renegotiate everything from a standing start.
Upside belongs in the same register. A positive risk entry, a competitor exiting, a regulation opening a market, gets an owner and a trigger exactly as a threat does. NC State’s ERM Initiative draws the same conclusion from the WEF data: the winners will be the organizations that treat volatility as raw material.
Lessons from Programs That Failed
Programs that add no value share recognizable defects, and most of them are deliberate design choices, made early and left unexamined. The risk-adjusted view of disruption in the WEF data makes the stakes plain. The table pairs each failure with the fix we have seen work in practice.
| Failure pattern | Why value dies | Fix that works |
| Register as annual ritual | Risks priced once, stale by Q2 | Quarterly repricing on the governance calendar |
| No link to decisions | Analysis nobody uses in approvals | Risk sign-off embedded in the deal process |
| Warnings without escalation | The Boar’s Head pattern: logged, not acted on | Named owner and deadline per finding |
| Compliance-only framing | Program stops at the legal minimum | Opportunity entries beside every threat |
| Unmeasured value | Board funds it grudgingly, cuts it first | The five metrics, reported quarterly |
The integration fix underwrites all the other remedies on the list. Risk management bolted on as a separate department produces reports and little else; an integrated approach wired into planning, procurement, and portfolio decisions produces different choices. Value comes from the second one.
How Risk Management Adds Value: Your Questions Answered
What proof exists that risk management adds value?
Three current datasets: IBM’s 2025 breach report shows detection controls cutting the global average cost 9% to $4.44 million; PwC’s Risk Pioneers, the top 5%, outgrow the survey average; and enforcement records like Boar’s Head’s 69 logged violations show the cost of absence in deaths, recalls, and closures.
How do you measure whether risk management adds value to the business?
Track five metrics quarterly: incident loss trend against a three-year baseline, near-miss-to-loss ratio, total cost of risk as a share of revenue, the percentage of major decisions carrying a quantified assessment, and audit finding closure. Falling insurance pricing at renewal is independent confirmation.
Where does the evidence show risk management adds value fastest?
Wherever losses are frequent and measurable: cyber, safety, and supplier disruption. IBM’s data shows detection and automation paying back within a single reporting year. Continuity and reputation value accrue more slowly but dominate the total when a severe event arrives, as the Boar’s Head closure demonstrates.
How does risk appetite ensure risk management adds value rather than blocking risk?
Appetite draws the line between risks to take and risks to refuse, in writing. That converts the program from a brake into a routing mechanism: deals inside the band proceed quickly, deals outside it get senior scrutiny. The result is faster approvals for good risk, which is where growth value comes from.
Which framework components make sure risk management adds value?
Four are non-negotiable: a scored register with named owners, a written appetite ratified by the board, response plans with escalation deadlines, and monitoring metrics reviewed on a calendar. ISO 31000 and COSO ERM both wrap these in governance so the components survive leadership changes.
What stops teams from proving risk management adds value day to day?
Counting the wrong things. Teams report activity, workshops held and risks logged, while the outcomes go unreported: losses avoided, decisions changed, findings closed. Switching the report to outcome metrics usually takes one quarter and changes the budget conversation immediately, because absence of loss becomes visible as a number.
The Regulatory and Technology Horizon
Two shifts will raise the value of a working program through 2027. Regulators keep converting risk management from good practice into legal duty: operational resilience rules in banking, food-safety modernization after the 2024 outbreaks, and AI governance obligations arriving on both sides of the Atlantic. Absence is becoming a citable offense.
Technology moves the other direction, cutting the cost of running a program. IBM’s data already shows AI-driven detection shrinking breach costs, and the same automation is reaching registers, KRIs, and scenario models. The price of discipline is falling while the price of its absence climbs, which widens the value gap every year.
The organizations that win that spread will be the ones treating risk work as a core enterprise capability, funded and staffed like one. Half the world’s risk leaders expect turbulence; the top 5% have already turned it into a growth input. The rest are funding their education one loss at a time.
If your board still asks what the risk program is for, build the answer in numbers: the register, the appetite band, and the five metrics that prove the value. Our risk advisory services set them up with your team; contact us to start with a one-week baseline. Sixty-nine warnings deserve better than a filing cabinet.

Chris Ekai is a Risk Management expert with over 10 years of experience in the field. He has a Master’s(MSc) degree in Risk Management from University of Portsmouth and is a CPA and Finance professional. He currently works as a Content Manager at Risk Publishing, writing about Enterprise Risk Management, Business Continuity Management and Project Management.