Risk in finance is the chance that an investment’s actual return differs from the return you expected, including losing part or all of the capital. Analysts quantify it with standard deviation, beta, and value at risk, then split it into market, credit, liquidity, operational, inflation, and business risk for management.
Over two trading days in early April 2025, US equities shed roughly $6.6 trillion in market value, the largest two-day loss on record. The S&P 500 fell almost 10 percent across those sessions after sweeping new tariffs landed on April 2.
Cboe’s fear gauge, the VIX, peaked at 52.33 before an April 9 tariff pause turned the slide into one of the sharpest rallies in years. Nothing fundamental about the underlying companies changed in that week. The price of uncertainty did.
| Risk in Finance: Key Takeaways |
| April 3-4, 2025 erased roughly $6.6 trillion from US equities in two days, the largest two-day loss on record, with the VIX peaking at 52.33. |
| The Fed’s November 2025 survey ranks policy uncertainty (61%) and geopolitical risk (48%) as the top threats to financial stability. |
| Concern about higher long-term rates jumped fivefold in a year, from 9% to 43% of the Fed’s surveyed contacts. |
| The IMF’s October 2025 report warns that stretched valuations and nonbank intermediaries hide fragility beneath calm markets. |
| Six types organize financial risk: market, credit, liquidity, operational, inflation, and business; real losses usually combine several. |
| AI entered Allianz’s 2026 top risks at #2 (32% of responses), so model risk now belongs on financial risk registers alongside cyber. |
That whiplash is the subject here: what risk in finance means, how professionals measure it, and which controls keep a portfolio alive through weeks like that one. Every number ahead comes from the IMF, the Federal Reserve, Cboe, or another named source.
What Risk in Finance Actually Measures
Strip the jargon and the definition is narrow. The SEC’s investor education arm defines risk as the degree of uncertainty around an investment’s return, including the chance of losing the money you put in. Finance turns that uncertainty into a number, usually the standard deviation of returns.
Two halves make up the total. Systematic risk moves whole markets at once, the way April’s tariff shock hit every sector together, and no amount of diversification removes it. Unsystematic risk belongs to one company or industry, and spreading positions can nearly eliminate it.
| Dimension | Systematic risk | Unsystematic risk |
| Source | Market-wide forces: rates, inflation, tariffs | One firm or sector: strategy, fraud, product |
| Diversifiable? | No; it survives any portfolio mix | Largely yes, across enough positions |
| April 2025 example | Every sector fell on the tariff news | Single names that fell further on exposure |
| How it is measured | Beta against a market index | Company analysis, position sizing |
The definition stays the same outside trading floors, as the Association of Corporate Treasurers frames it. A treasurer weighing counterparty risk on a deposit and a CFO pricing currency swings manage the same object. That object is the gap between expected and actual outcomes, with real capital attached.
Why 2026 Feels Riskier Than the Textbooks
Definitions meet an unusually loaded backdrop. The IMF’s October 2025 Global Financial Stability Report, titled Shifting Ground beneath the Calm, warns that risk-asset prices sit well above fundamentals while nonbank intermediaries quietly amplify every shock. Calm markets, it argues, are hiding stretched foundations.
The Federal Reserve’s own soundings agree. Its November 2025 Financial Stability Report survey put policy uncertainty first at 61 percent of respondents, with geopolitical risk at 48 percent. Worries about higher long-term rates jumped fivefold to 43 percent, and AI joined the list at 30 percent.
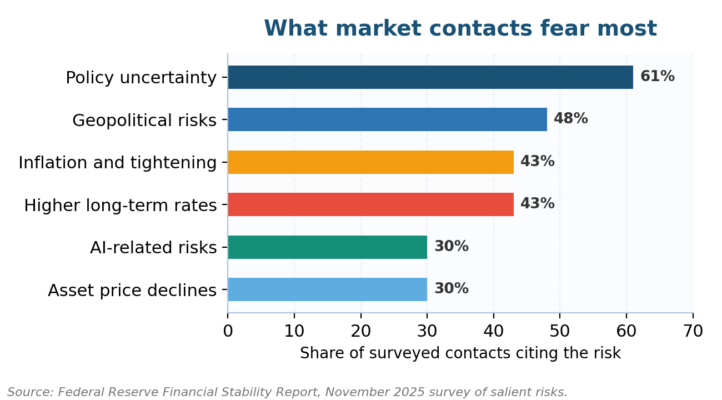
Figure 1. Policy uncertainty leads the Fed’s November 2025 survey of salient risks at 61 percent.
Corporate risk officers rank the field similarly. Allianz’s 2026 Risk Barometer, drawn from 3,338 experts across nearly 100 countries, kept cyber incidents first while AI vaulted from tenth to second at 32 percent. Both now sit inside mainstream financial risk registers, filed beside market and credit exposure.
The Six Risk Types That Move Money
Surveys name the worries; a taxonomy makes them workable. Market risk covers price moves in equities, rates, currencies, and commodities, and it is the type that erased $6.6 trillion in April. Credit risk is the chance a borrower or counterparty stops paying.
| Type | What it covers | Recent marker |
| Market risk | Price moves in equities, rates, FX, commodities | April 2025: $6.6T lost in two days |
| Credit risk | Borrower or counterparty default | 145 corporate defaults in 2024 (S&P) |
| Liquidity risk | Assets that cannot sell fast at fair value | Fed flags private credit redemption pressure |
| Operational risk | Failed processes, people, systems, fraud | Cyber ranked #1 business risk again in 2026 |
| Inflation risk | Purchasing power eroding fixed cash flows | Rates concern at 43% of Fed contacts |
| Business risk | Earnings falling short of the plan | Tariff exposure repricing whole sectors |
Liquidity risk gets sharper as funds promise daily redemptions on assets that trade monthly, a mismatch the Fed flags in private credit. Operational risk covers failed processes, people, and systems. Operational loss examples run from fat-finger trades to ransomware that halts settlement.
Inflation and business risk round out the six. Inflation taxes every fixed cash flow it touches, and business risk tracks whether the enterprise earns what its plan assumed. Banks carry all six at once, visible each quarter in the FDIC’s banking profile, which is why bank credit risk management fills its own playbook.
Measuring Risk: From Standard Deviation to Stress Tests
Naming a risk without sizing it changes nothing. Standard deviation shows how widely returns swing, beta compares a position’s moves against the market, and value at risk estimates the worst expected loss at a chosen confidence level. Each answers a different question.
| Metric | Question it answers | Blind spot |
| Standard deviation | How widely do returns swing? | Treats upside and downside alike |
| Beta | How hard does the market pull this position? | Backward-looking, regime-dependent |
| Value at risk (VaR) | What is the worst loss at 95-99% confidence? | Silent about the tail beyond it |
| Maximum drawdown | How deep was the worst peak-to-trough fall? | Only knows history |
| Stress and scenario tests | What breaks under a specific shock? | Only as good as the scenarios |
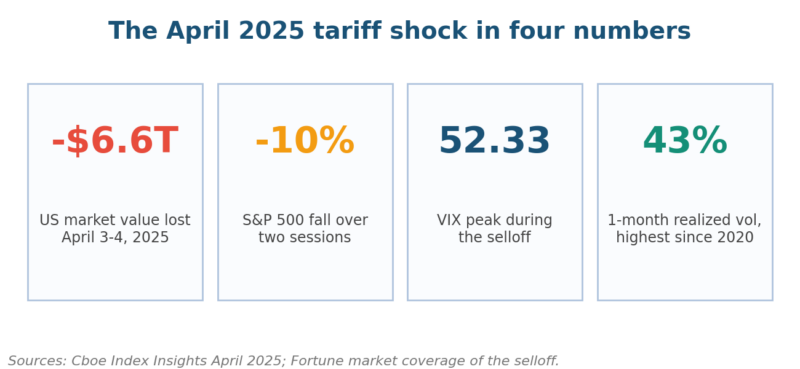
Figure 2. Four numbers from the April 2025 selloff, the stress scenario now sitting in every playbook.
April 2025 showed the blind spots in action. One-month realized volatility ran to nearly 43 percent, the highest since 2020, per Cboe’s April review, and models calibrated on quiet years underpriced the move. Stress tests and scenario analysis exist for exactly these tails.
Quantities need judgment around them. A structured risk assessment methodology pairs the statistics with likelihood-and-impact scoring, and S&P’s default data, 145 corporate failures in 2024, reminds modelers that credit tails are fat. Numbers frame the decision; they never make it alone.
How to Manage Risk in Finance Without Killing Returns
Management starts with a written boundary. Risk appetite statements set how much variability the portfolio or firm accepts before action triggers, and ISO 31000 supplies the process wrapper: identify, analyze, treat, monitor. Everything after that boundary is technique, applied in layers.
- Diversify across assets, sectors, and geographies so one shock cannot sink the whole portfolio
- Hedge concentrated exposures with options, futures, or swaps, and treat the premium as an insurance cost
- Match asset liquidity to liability timing before chasing yield in private markets
- Insure the operational tails: cyber, fraud, and business interruption
- Rebalance on a calendar, not on adrenaline
Hedging has a visible price tag. ISDA’s margin survey counts $1.6 trillion of collateral behind dealers’ derivative books at year-end 2025, capital that earns little while it guards the downside. The Basel III framework exists to keep that protection funded before stress arrives.
| Strategy | Protects against | Watch-out |
| Diversification | Unsystematic, single-name loss | Correlations spike toward 1 in a crisis |
| Hedging | Defined market moves | Premium drag; imperfect offsets |
| Insurance | Operational and casualty tails | Exclusions bite in systemic events |
| Asset-liability matching | Liquidity squeezes | Costs yield in calm markets |
| Limits and appetite | Concentration and drift | Stale if reviewed annually |
| Capital buffers | Losses that exceed all of the above | Expensive; regulators set the floor |
Institutions layer the same moves at scale. Interest rate risk programs at banks pair duration limits with hedges, and an enterprise risk management framework connects portfolio-level choices to board oversight. The counterparty risk guide covers the bilateral piece of the same problem.
Lessons the April 2025 Selloff Left Behind
Weeks like early April compress years of theory. Diversification inside equities failed, because tariff risk was systematic, and even Treasuries wobbled as hedges before the April 9 pause. The distinction between systematic and company-specific risk stopped being academic for anyone holding a portfolio.
Speed was the second lesson. The VIX went from roughly 30 to 52.33 inside a week, so limits reviewed monthly were limits reviewed too late. Firms that pre-wired escalation rules, the kind a risk management lifecycle formalizes, adjusted while others were still convening committees.
Drift is the quieter lesson. Concern about higher long-term rates sat at 9 percent of the Fed’s surveyed contacts a year earlier; by November 2025 it hit 43 percent. Risks migrate from footnote to headline fast, and monitoring KRIs exist to catch the migration early.
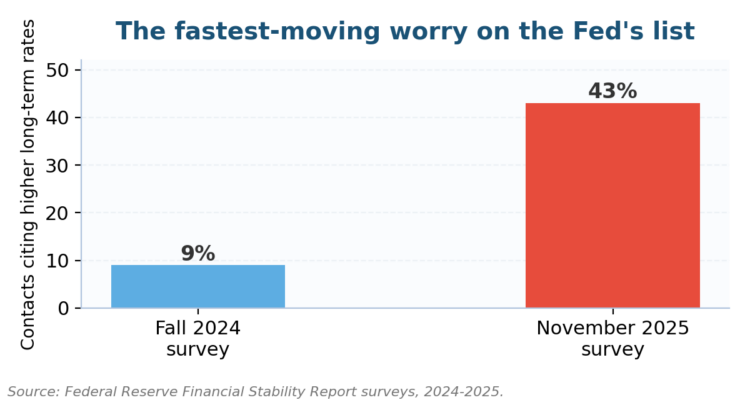
Figure 3. The rates worry went from fringe to near the top of the Fed’s survey in twelve months.
Risk in Finance: Your Questions Answered
What is risk in finance in simple terms?
Risk in finance is the possibility that an investment returns less than you expected, including losing the money entirely. It gets measured as the spread of possible outcomes, usually standard deviation. Higher expected returns come packaged with wider spreads, which is the trade every portfolio decision negotiates.
What are the main types of financial risk?
Six types cover most financial risk: market, credit, liquidity, operational, inflation, and business risk. Market and inflation risk hit whole economies at once, while credit, operational, and business risk attach to specific firms. Most real losses combine two or more, the way a rate shock exposes hidden liquidity gaps.
How is risk in finance measured?
Analysts measure risk in finance with standard deviation for return spread, beta for market sensitivity, value at risk for worst expected loss, and maximum drawdown for peak-to-trough damage. Stress tests then push portfolios through scenarios like April 2025, when one-month realized volatility neared 43 percent.
What is the difference between systematic and unsystematic risk?
Systematic risk comes from market-wide forces, such as rate moves, inflation, or the April 2025 tariff shock, and diversification cannot remove it. Unsystematic risk is specific to one company or sector and largely disappears in a well-spread portfolio. Beta measures the first; position sizing controls the second.
Can financial risk ever be eliminated?
No. Financial risk can be transferred, hedged, diversified, or priced, but some exposure always remains, and removing all of it would remove the return too. The practical goal is matching retained risk to a written appetite, then watching that the match still holds as markets move.
How much risk in finance should an investor accept?
Match risk to three inputs: the time until you need the money, your capacity to absorb a loss without changing plans, and your documented tolerance for volatility. A written risk appetite beats improvisation, because April-style weeks convert vague comfort levels into forced selling at the bottom.
Mistakes That Turn Volatility Into Loss
Losses in stressed markets trace to choices made in calm ones. The table collects five recurring mistakes with the fix each one needs, drawn from the post-April reviews now circulating through risk committees. Most of them survive quiet quarters completely unnoticed.
| Mistake | Why it hurts | Fix |
| Chasing yield into illiquid assets | Redemptions arrive faster than sales settle | Match holdings to the real cash horizon |
| Calibrating models on calm windows | Volatility estimates lag regime changes | Keep 2020 and April 2025 in the sample |
| Trusting one metric | VaR is silent beyond its confidence level | Pair VaR with drawdown and stress tests |
| Assuming diversification always works | Correlations spike toward 1 under stress | Stress the portfolio with correlations up |
| Leaving appetite unwritten | Panic decides at the bottom | Board-approved appetite with triggers |
The Horizon: AI, Debt, and the Next Shock
AI is the loudest newcomer on the 2027 horizon. It took second in Allianz’s barometer at 32 percent while the Fed’s contacts flag it at 30, readings that put model risk on the same register page as cyber. Treat technology risk as a financial category now.
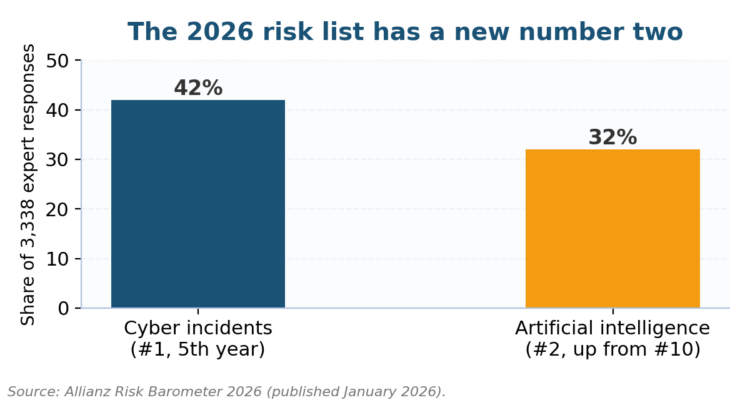
Figure 4. Cyber holds first place for a fifth year while AI jumps eight ranks to second, per Allianz.
Sovereign debt moves more slowly and lasts longer. The IMF flags widening deficits pressing on bond markets while regulators keep banking rules tuned through Basel III, so rate volatility stays a first-order model input. Position limits and duration books should assume it stays.
For weighing whether formal programs pay their way, the advantages and disadvantages of risk management deserve honest reading; controls cost money and still miss tails. The April lesson holds either way: the firms that wrote their rules in calm markets kept them in loud ones.
Investors and finance teams that want the framework drawn up can hand us the heavy lifting. We build risk registers, appetite statements, and measurement dashboards aligned to ISO 31000 and COSO. The services page shows scope options; a note through the contact form gets a scoped proposal back inside a week.

Chris Ekai is a Risk Management expert with over 10 years of experience in the field. He has a Master’s(MSc) degree in Risk Management from University of Portsmouth and is a CPA and Finance professional. He currently works as a Content Manager at Risk Publishing, writing about Enterprise Risk Management, Business Continuity Management and Project Management.