
An environmental monitoring risk assessment identifies where microbial and particulate contamination is most likely to reach product, scores each location by severity and likelihood, and uses those scores to set sampling sites, frequencies, and alert levels. EU GMP Annex 1 and ICH Q9(R1) both require this risk basis for every monitoring program.
On February 17, 2022, Abbott Nutrition recalled nearly every powdered formula made at its Sturgis, Michigan plant after FDA investigators found Cronobacter sakazakii in five environmental subsamples. The same inspection record documented eight separate Cronobacter detections at the site between fall 2019 and February 2022.
The fallout ran far beyond one facility. National out-of-stock rates for infant formula hit 40 to 50 percent that spring, the White House invoked the Defense Production Act, and Operation Fly Formula airlifted supply from Europe while parents drove across state lines hunting for stock.
Sturgis had monitoring data; what it lacked was a disciplined environmental monitoring risk assessment that forced action on the trend. We build these assessments for a living, and the method regulators now expect is teachable: score the sites, justify the frequencies, act on the signals.
What an Environmental Monitoring Risk Assessment Actually Covers
Sturgis is the cautionary tale; the definition explains why. An environmental monitoring risk assessment is a documented exercise that maps every route by which microbial or particulate contamination can reach product, scores each route, and converts those scores into sampling sites, methods, and frequencies.
The scope runs wider than petri dishes. A complete assessment covers viable and non-viable monitoring across air, surfaces, personnel, water, and compressed gases, and it slots into the plant’s wider contamination control strategy alongside cleaning validation and GMP risk assessment work. Our guide to what a risk assessment involves covers the underlying method.
| Monitoring target | Primary contamination route | Standard methods |
| Air (viable) | Personnel shedding, airflow disruption near open product | Active air samplers, settle plates |
| Surfaces | Touch transfer, gaps in cleaning and disinfection coverage | Contact plates, swabs for irregular spots |
| Personnel | Gowning breaks, aseptic technique drift over a shift | Glove prints, gown contact plates |
| Water and utilities | Biofilm in loops, drains, and point-of-use fittings | Bioburden and endotoxin testing |
| Air (non-viable) | Equipment wear, intervention and material traffic | Particle counters at 0.5 and 5.0 micron |
Method selection matters less than the coverage logic behind it. The FDA’s aseptic processing guidance expects firms to show why each site was chosen, and ISO 14644-1 fixes the particle classes those choices operate within. Inspectors read the justification before they read the results.
A defensible assessment pulls evidence from every function that touches the cleanroom, and we insist on a cross-functional team armed with structured risk identification techniques. Before scoring anything, gather these inputs, each of which shifts at least one site score:
- Airflow visualization (smoke) studies showing turbulence near open product
- Cleaning and disinfection validation results, including coverage gaps
- Two to three years of historical monitoring data with locations of past recoveries
- Intervention and personnel-flow logs pulled from batch records
- Maintenance and shutdown history for HVAC and isolator systems
The Sturgis numbers repay study because every failure mode was visible in routine data long before the recall. Eight positives over three years is a trend, and a trend is exactly what a risk-based review cycle is built to catch.
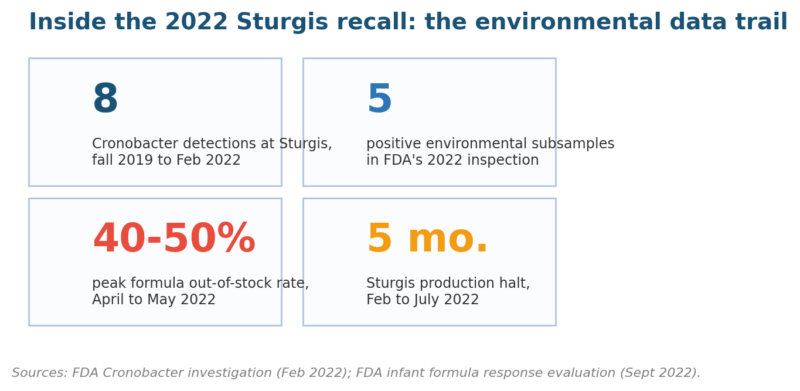
Figure 1. The environmental record at Sturgis: eight detections preceded the February 2022 recall.
Why Regulators Stopped Accepting Grid-Style Sampling
That trend-blindness explains the regulatory shift. For years, firms picked sampling sites on a rough grid and defended them by habit; three rule changes between 2022 and 2023 ended that era, and each one names risk assessment as the required basis for monitoring design.
The revised EU GMP Annex 1, in force since August 25, 2023, requires a documented contamination control strategy and states that quality risk management must justify monitoring locations and frequencies. ICH Q9(R1), adopted in January 2023, sharpened the toolkit by tackling subjectivity in scoring and matching formality to risk.
The FDA reads from the same page. Published inspection data show the most-cited violations for sterile drug manufacturers in 2023 were 21 CFR 211.42, 211.113, and 211.67: facility design, microbial contamination control, and equipment cleaning. All three trace straight back to weak monitoring rationale.
| Regulatory driver | In force | What it demands of monitoring |
| EU GMP Annex 1 (2022 revision) | Aug 25, 2023 | A contamination control strategy; QRM-justified sites, frequencies, and limits |
| ICH Q9(R1) | Jan 18, 2023 | Anchored, less subjective scoring; formality matched to risk; supply impact weighed |
| FDA aseptic processing guidance | 2004, current | Site selection tied to product exposure; documented trend review |
| 21 CFR 211.42 and 211.113 | Ongoing | Adequate facility zoning; written procedures to prevent microbial contamination |
| FSMA preventive controls rule | 2016, ongoing | Environmental monitoring wherever ready-to-eat food is exposed |
Food plants sit under the same logic. The FSMA preventive controls rule requires environmental monitoring wherever ready-to-eat food is exposed before packaging, and the FDA backed it with in-plant swabbing campaigns targeting Listeria and Cronobacter. A HACCP-style matrix translates cleanly, and SQF-certified sites already hold most of the needed records.
Annex 1 also fixed the numbers that risk scores must respect. The air action limits fall a hundredfold between Grade D and Grade B, then reach zero tolerance in Grade A, where any single recovery triggers an investigation and a review of the assessment itself.
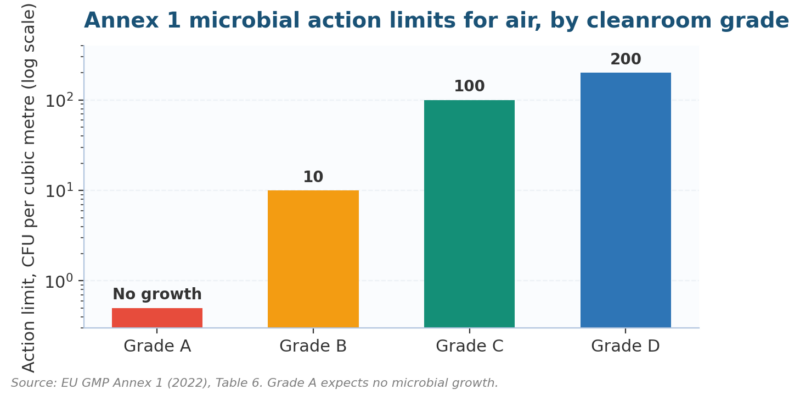
Figure 2. EU GMP Annex 1 (2022) Table 6 air action limits: Grade A expects no growth at all.
How to Run an Environmental Monitoring Risk Assessment in Six Steps
Knowing the rules is half the job; the working method is the other half. Our six-step sequence follows the step-by-step risk assessment structure we apply across industries, tuned for contamination pathways, and it produces the paper trail an inspector asks to see first.
| Step | What you do | Record it creates |
| 1 | Map material, personnel, and waste flows; overlay smoke-study airflow data | Annotated facility map with exposure points |
| 2 | List contamination sources and transfer routes: people, water, air, surfaces, materials | Source-to-product route register |
| 3 | Score every candidate site for severity, likelihood, and detectability on anchored scales | Scored site inventory |
| 4 | Rank the scores; assign methods and cadence by risk band | Sampling plan with per-site rationale |
| 5 | Set alert and action levels from 12 or more months of baseline data | Level justification memo |
| 6 | Fix an annual review plus defined reopening triggers | Living assessment with change log |
Two of the six steps carry most of the failure risk. Step 3 collapses when scales lack written anchors, and step 5 collapses when limits are copied from the regulation instead of built from plant data. Process validation programs fail the same two ways, and for the same reasons.
There is a policy reason the six steps now demand this rigor. ICH Q9(R1) explicitly added product availability risk to quality risk management, a direct response to shortage events, and the Federal Register adoption notice makes it formal FDA guidance. A weak assessment now carries supply consequences, and regulators say so.
Step 6 gets the least attention and repays the most. A static assessment ages badly because plants change constantly, so we anchor reviews to a defined cadence and reopen the scoring whenever any of these events lands on the quality record:
- Any action-level excursion, or an adverse trend across alert levels
- New or relocated equipment, line extensions, or HVAC rebalancing
- Changes to cleaning agents, disinfectant rotation, or gowning procedure
- Extended shutdowns, nearby construction, or water-system interventions
- A new product with different exposure characteristics entering the suite
Scoring Sampling Sites by Severity, Likelihood, and Detectability
Step 3 deserves its own section because it decides everything downstream. We score each candidate location on three factors borrowed from FMEA, and the likelihood definitions get written anchors so two assessors reach the same number for the same site.
| Factor | Question it answers | Anchored 1-5 scale |
| Severity | If contamination sits here, can it reach exposed product? | 1 = remote support area; 5 = direct product contact or first air |
| Likelihood | How often do transfer events actually occur here? | 1 = no traffic or interventions; 5 = constant personnel activity |
| Detectability | Would routine methods catch growth here quickly? | 1 = continuous monitoring in place; 5 = blind spot between samplings |
Multiply the factors and band the results. In our template, anything scoring 15 or above gets every-batch or continuous monitoring, mid-band sites go weekly, and low scores justify monthly checks. The 5×5 matrix template and heat map workbook make the banding explicit and auditable.
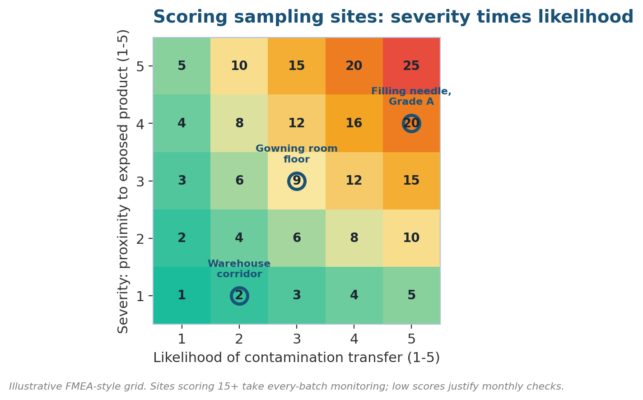
Figure 3. A filling needle in Grade A outranks a warehouse corridor twentyfold before frequency is even discussed.
Beware the quiet failure mode: scoring everything medium. ICH Q9(R1) added its subjectivity language precisely because committees drift toward threes, which produces a flat map and a sampling plan no better than the old grid. Force spread by ranking sites against each other, worst first.
Alert Levels, Action Levels, and Recovery Rates That Hold Up
Scores set the where and how often; levels set the so what. An alert level flags drift from baseline, an action level demands documented response, and both must come from your own data rather than a lookup table, a distinction inspectors probe hard.
USP chapter <1116> changed how the aseptic core reads its data. Because a single CFU count is unreliable at very low levels, the chapter recommends contamination recovery rates: the share of samples showing any growth at all. Suggested rates run under 1 percent for ISO 5 up to 10 percent for ISO 8.
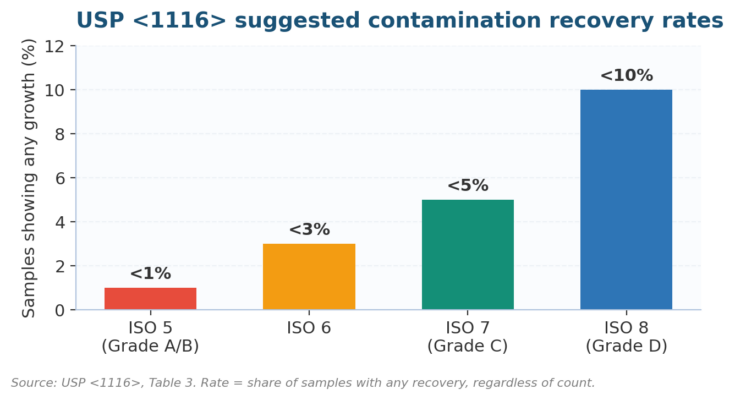
Figure 4. Recovery rates reframe monitoring as detection frequency, the metric USP <1116> asks you to trend.
| Grade | ISO class at rest | Air action limit (CFU/m3) | Contact plate (CFU/plate) |
| A | ISO 4.8 (5) | No growth | No growth |
| B | ISO 5 | 10 | 5 |
| C | ISO 7 | 100 | 25 |
| D | ISO 8 | 200 | 50 |
Trend review turns levels into intelligence. We treat recovery-rate drift as a key risk indicator and feed it into the same dashboard leadership already reads, because a rate creeping from 2 to 4 percent tells you a control is failing months before an action-level hit. The same drift, charted quarterly, is the cheapest early warning a sterile operation can buy.
When an action level trips, the response sequence must already be written, trained, and rehearsed, because improvisation under deadline is how firms collect the 483 observations FDA inspection histories describe. The minimum sequence we specify for pharmaceutical and food clients runs:
- Verify the result and re-sample the location plus adjacent sites
- Identify the organism to species; compare it against the site’s historical flora
- Review interventions, cleaning logs, and personnel records for the window
- Assess product impact with QA sign-off before batch disposition
- Feed the finding back into the site’s risk score and mitigation plan
Frequently Asked Questions About Environmental Monitoring Risk Assessment
The questions below come from audits and reader mail, phrased the way practitioners search them. Each answer stands alone, so skim for the one that matches the decision in front of you, and follow the links for the deeper method pieces.
How often should an environmental monitoring risk assessment be reviewed?
At least annually, and immediately after any action-level excursion, facility change, extended shutdown, or new product introduction. Annex 1 treats the assessment as a living part of the contamination control strategy, so a two-year-old document with no change log reads as a finding waiting to be written.
What separates an environmental monitoring risk assessment from a contamination control strategy?
The contamination control strategy is the umbrella document covering every control in the plant: design, cleaning, sterilization, personnel, and monitoring. The environmental monitoring risk assessment is one input beneath it, the analysis that justifies where, how, and how often you sample. Annex 1 expects both, cross-referenced.
Which scoring tools work for an environmental monitoring risk assessment?
FMEA adapts best because severity, occurrence, and detectability map directly onto contamination questions, while HACCP decision trees suit food operations. Whatever the tool, ICH Q9(R1) requires anchored scales and written rationale. Scenario-based approaches help stress-test the plan against events like shutdowns or construction.
Does a food facility need an environmental monitoring risk assessment?
Yes, wherever ready-to-eat product is exposed to the environment before packaging. The FSMA preventive controls rule makes environmental monitoring a required verification activity in those conditions, and FDA swabbing has repeatedly found Listeria and Cronobacter in plants whose own programs missed them. Sturgis made the stakes national news.
Who should own the environmental monitoring risk assessment?
Quality assurance owns the document, but the scoring team must include production, engineering, microbiology, and cleaning or sanitation leads. Single-function assessments miss transfer routes that operators see daily, and ICH Q9(R1) flags exactly that kind of blind-spot subjectivity. The five-step risk process gives the team a shared vocabulary.
What data should feed an environmental monitoring risk assessment?
Twelve months or more of historical recoveries, smoke-study airflow maps, cleaning validation results, intervention logs, and maintenance history form the core set. Data integrity matters as much as data volume, since scores built on incomplete records inherit their gaps; our data integrity risk assessment covers the checks worth running first.
Six Traps That Derail Monitoring Programs
Most failed programs share an anatomy, and a 21-year review of FDA enforcement reports shows how repetitive it is: the same organisms, the same gaps, the same product classes. The table pairs each trap with its mechanism and the correction we apply on remediation work.
| Trap | Why it happens | Correction |
| Grid sampling defended by habit | Sites inherited from qualification, never re-scored | Re-run site scoring; retire low-value sites with documented rationale |
| Every site scored medium | Committee compromise; no anchored scales | Force-rank sites; write scale anchors with concrete examples |
| Limits copied from the regulation | Baseline data never analyzed | Set alert levels from 12+ months of plant data |
| Excursions closed as lab error | Investigation burden discourages honest closure | Require species ID and adjacent-site data before closure |
| Trends reviewed but never acted on | Reports go to a mailbox, not a meeting | Put recovery rates on the quality council agenda |
| Assessment frozen after approval | No reopening triggers defined | Add event triggers and an annual review clock |
The fourth trap deserves a second look because it is the Sturgis pattern in miniature. A peer-reviewed analysis of contaminated medicinal products reached the blunt conclusion that recurring organisms signal persistent reservoirs, and a reservoir means the map, not the sample, is wrong.
The Regulatory and Technology Horizon
Expect Annex 1 enforcement to keep tightening through 2027. EMA and FDA inspectors now ask for the contamination control strategy in the opening meeting, and firms whose assessments predate August 2023 are being told to rebuild them rather than patch them.
Technology is moving the same direction. Rapid microbial methods and continuous viable particle counters shrink the blind spot between samplings, which changes detectability scores and, with them, the whole map; PDA’s implementation work on Annex 1 tracks adoption closely. Reassess when you install them, because better detection rewrites the third scoring factor.
On the food side, FDA has kept infant formula and ready-to-eat facilities under elevated scrutiny since Sturgis, and Cronobacter became a nationally notifiable disease in 2024. Environmental data will decide more recalls, more consent decrees, and more shortage events than finished-product testing ever has.
A monitoring plan that cannot show the scoring behind each site will not survive its next audit unchanged. We rebuild environmental monitoring risk assessments for pharmaceutical and food plants, from site scoring through level setting. See what our services cover, then send us your floor plan to scope the work.

Chris Ekai is a Risk Management expert with over 10 years of experience in the field. He has a Master’s(MSc) degree in Risk Management from University of Portsmouth and is a CPA and Finance professional. He currently works as a Content Manager at Risk Publishing, writing about Enterprise Risk Management, Business Continuity Management and Project Management.