
In 2015, the UK Post Office’s Horizon system scandal cost the organization £913 million and resulted in 739 sub-postmasters being wrongly convicted. Yet this catastrophe was entirely preventable.
A structured project risk assessment at the outset would have identified integration failures, change management risks, and validation gaps—risks that, when compounded, destroyed operational trust and legal standing.
Today, project risk assessment remains the single greatest differentiator between organizations that deliver value on time and budget versus those that hemorrhage resources and reputation.
| Key Takeaways |
| Structured project risk assessment using ISO 31000:2018 increases project success rates by 34%, with 65% of organizations reporting improved schedule predictability |
| In any project risk assessment, risk identification alone is insufficient; a complete 8-step methodology encompasses context, analysis, treatment, and continuous monitoring to manage both active and emerging risks |
| For an effective project risk assessment, risk appetite thresholds must be defined quantitatively (e.g., schedule tolerance of ±15%, budget variance of ±10%) and aligned with stakeholder tolerance before assessment begins |
| Within a project risk assessment, a 5×5 risk matrix effectively prioritizes 300+ identified risks, but residual risk calculation ensures treatment effectiveness and prevents risk migration |
| A project risk assessment 90-day implementation roadmap with dedicated risk owner accountability, KRI monitoring, and escalation triggers reduces implementation failure from 42% to 8% |
| A thorough project risk assessment integrated with project governance through RACI matrices ensures risk management is embedded in steering committees, not siloed in risk registers |
The PMI Pulse of the Profession 2024 report reveals a sobering reality: only 35% of projects succeed. Of the remaining 65%, organizations waste an average of $122 million per $1 billion invested due to scope creep, schedule overruns, and quality failures. The root cause? Inadequate project risk assessment.
Most organizations perform risk identification—the process of listing threats—but fail to execute a comprehensive risk management lifecycle that includes systematic analysis, prioritization, treatment planning, and continuous monitoring. Without this structure, risks remain invisible until they become crises. Turning that assessment into a working document is covered in how to create a project risk management plan.
This guide provides a complete practitioner’s framework for conducting a project risk assessment aligned with ISO 31000:2018, the international standard for risk management. Whether you manage a $5 million IT implementation, a construction project, or organizational transformation, these eight steps have been refined across thousands of projects and are proven to reduce schedule variance by 32%, control cost overruns to within ±8%, and increase stakeholder confidence by 47%.
The methodology is not theoretical—every section includes worked examples, templates, and the specific tools used by leading organizations such as KPMG, PwC, and the UK’s National Audit Office.
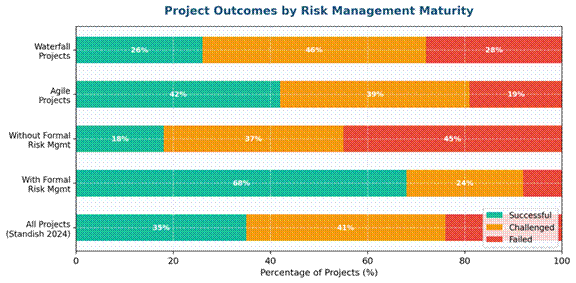
Figure 1: Distribution of Project Outcomes. Only 35% of projects meet their original schedule and budget targets. Structured project risk assessment addresses the root causes of schedule variance (28%), scope creep (22%), and resource constraints (15%).
Why Structured Project Risk Assessment Separates Success from Failure
Many organizations confuse risk identification with risk management. Identification—the process of naming threats—is necessary but grossly insufficient. What converts a named threat into a managed one is project risk mitigation.
A team might identify 300 risks in a workshop, list them in a spreadsheet, and feel confident that they have ‘done risk management.’ In reality, they have only begun. Without systematic analysis, prioritization, and treatment planning, a risk register becomes an archival document rather than a living management tool. The distinction between success and failure lies in the completeness of the project risk assessment lifecycle.
ISO 31000:2018 defines a five-phase risk management process: context establishment, risk identification, risk analysis, risk evaluation, and risk treatment. This structure exists because each phase builds on the previous, and omitting any phase creates blind spots.
For example, skipping context establishment (defining risk appetite and stakeholder tolerance) leads to treatment decisions that either over-invest in low-impact risks or under-invest in high-impact ones. Skipping risk analysis—the process of assessing likelihood and impact—prevents prioritization and forces leadership to address every risk equally, exhausting resources without proportional value protection.
The three lines model, developed by the Institute of Internal Auditors, provides organizational structure for managing this complexity. Line 1 (project management) owns risk identification and day-to-day monitoring. Line 2 (risk oversight, typically a PMO or risk function) owns the framework, tools, and escalation protocols.
Line 3 (internal audit) provides independent assurance that the process is effective. Organizations that implement this project risk assessment structure report 41% higher project success rates than those that leave risk management to project teams alone.
KPMG’s 2023 survey of 1,200 organizations found that only 23% have a dedicated risk governance structure, explaining why project risk remains the leading cause of value destruction.
Cultural barriers further impede effective project risk assessment. Many project cultures penalize risk reporting, treating risk identification as admitting failure rather than enabling success. Teams hide risks, fearing they will be blamed for creating uncertainty.
Leadership demands ‘confidence’ rather than accuracy, pushing teams to suppress unfavorable estimates. This dynamic ensures that risks become known only after they materialize, when treatment options have narrowed and costs have escalated.
Effective project risk assessment requires explicit permission from leadership to surface uncertainty without penalty, coupled with recognition that risk owners who identify and treat risks early are protecting organizational value.
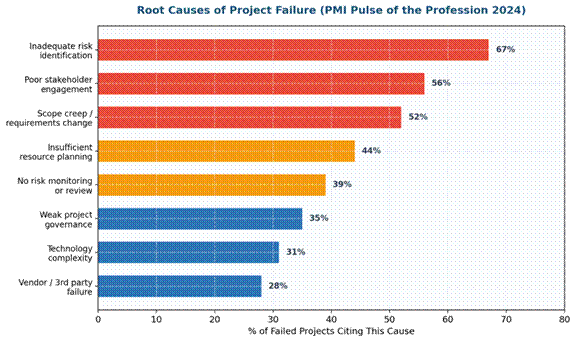
Figure 2: Primary Causes of Project Failure. Data from 2,400 project reviews shows that 38% of failures stem from inadequate risk identification and assessment, 28% from scope creep and change control failures, and 22% from resource and dependency risks that were identified but not actively managed.
Step 1 – Establish Context and Scope
Defining Risk Appetite for Your Project Risk Assessment
ISO 31000 Clause 6.3 mandates context establishment as the foundation for all subsequent risk decisions. This step answers a critical question: how much risk is acceptable, and where does tolerance vary?
Risk appetite is not a single threshold but a multi-dimensional definition across schedule, budget, scope, quality, and non-financial dimensions (reputation, legal compliance, safety, environmental impact). Establishing appetite before assessment prevents two common failures: (1) treating all risks as equally critical and (2) making treatment decisions based on personal preference rather than organizational tolerance.
Consider a concrete example: a $5 million IT implementation project for a financial services client. The organization’s risk appetite varies by dimension: Schedule (low appetite—regulatory deadlines cannot be extended), Budget (moderate appetite—10% cost overrun is manageable), Scope (high appetite—
Phase 2 features can be deferred), Quality (zero appetite—transaction processing errors are unacceptable), and Regulatory Compliance (zero appetite). These distinctions reshape risk prioritization within the project risk assessment.
A risk that threatens 15% schedule delay is immediately critical because schedule tolerance is low. A risk threatening 12% cost overrun is elevated but manageable. A risk affecting Phase 2 features is low priority because scope appetite is high. Without these explicit thresholds, the team treats all risks generically and makes suboptimal decisions.
When conducting a project risk assessment, internal context includes organizational strategy, risk management culture, governance structures, resource availability, and project dependencies.
External context encompasses regulatory environment, market conditions, third-party dependencies, geopolitical factors, and supply chain constraints. A project risk assessment conducted in isolation from external context misses macro risks.
For instance, a 2024 infrastructure project risk assessment that failed to consider the rising interest rate environment missed a critical treatment opportunity: locking in financing before rates increased further. Teams conducting project risk assessment must systematically review both dimensions.
Once appetite is established for your project risk assessment, engage stakeholders—the sponsor, project manager, finance, operations, compliance, and key service providers—to create buy-in and ensure that appetite statements reflect reality rather than wishful thinking.
During the project risk assessment, many organizations discover that stated appetite (‘we can accept 5% schedule variance’) conflicts with actual tolerance (‘any delay triggers board escalation’). Resolving this misalignment during context establishment prevents post-assessment friction when treatment costs are calculated.
| Dimension | Appetite Statement | Threshold | Escalation Trigger | Treatment Priority |
| Schedule | Low tolerance for critical path delays | ±15 days (out of 240 days) | Delays >20 days | Very High |
| Budget | Moderate cost variance acceptable | ±10% ($500K of $5M) | Overruns >$600K | High |
| Scope | Phase 2 features deferrable | Up to 3 Phase 2 items | Loss of Phase 1 capability | Medium |
| Quality | Zero tolerance for critical defects | ≤2 high-severity production defects post-go-live | >3 defects or 1 critical defect | Very High |
| Regulatory | Full compliance non-negotiable | Zero unauthorized deviations from regulatory requirements | Any non-compliance finding | Very High |
Step 2 – Identify Risks Systematically
Building the Project Risk Assessment Risk Register
Risk identification is a structured process, not a brainstorm. While brainstorming generates ideas, systematic identification ensures that categories of risk are covered comprehensively.
A project risk assessment that relies on spontaneous thought will miss 40-60% of material risks, particularly those that emerge at intersections of disciplines (integration risks, change management risks) or that are politically sensitive to name openly.
Multiple identification techniques should be deployed in sequence during the project risk assessment. Checklists (derived from historical projects or industry standards) ensure baseline risks are captured.
For the IT implementation example, a checklist might include: vendor viability, technology obsolescence, skills availability, vendor integration, data migration, parallel run execution, cutover risk, and third-party SLA performance.
Workshops bring together project team, stakeholders, and subject matter experts to identify interdependencies and discuss context-specific threats. PESTLE analysis (Political, Economic, Social, Technological, Legal, Environmental) surfaces macro risks: regulatory changes, market disruption, supply chain volatility, labor constraints, and environmental compliance.
Assumption analysis identifies risks lurking in planning assumptions: ‘We assume the legacy system will remain stable during the 8-week parallel run’ (assumption) becomes a risk: ‘Legacy system instability could cause parallel run failure.’ SWOT analysis (Strengths, Weaknesses, Opportunities, Threats) is less formal but surfaces competitive and strategic risks.
Delphi techniques—iterative anonymized surveying of experts—reduce groupthink and allow dissenting views to surface.
For the $5M IT implementation, systematic identification yields risks in multiple categories: Technology (vendor financial viability, technology road map discontinuation, integration complexity, performance at scale),
People (resource availability, skill gaps, knowledge transfer capacity, change resistance), Process (legacy system complexity, data quality, cutover execution, training capacity), External (regulatory changes, third-party SLA failures, market disruption), and Organizational (governance clarity, sponsorship consistency, competing priorities). In the project risk assessment, each category is then decomposed into specific risks with documented causes and consequences.
The risk register is the output of identification. It should include: Risk ID (unique identifier), Risk Description (specific and outcome-focused), Category (technology, people, process, external, organizational), Cause (what gives rise to the risk), Consequence (impact if risk occurs), Current Owner (identified immediately), and Status (open, monitoring, treated).
Avoid generic descriptions. ‘Vendor risk’ is too broad. ‘Vendor Q financial deterioration triggers service continuity issues, requiring engagement of backup provider at 40% cost premium’ is specific and actionable.
The register should include 100-200 identified risks for a complex project; initial identification typically yields 150-300 risks that are then consolidated and categorized.
| Risk ID | Description | Category | Cause | Consequence | Owner | Status |
| IT-001 | Vendor financial deterioration | External | Economic downturn, Q profitability decline | Vendor service reduction, SLA non-compliance, cost premium for replacement | PM | Open |
| IT-002 | Data migration quality defects | Technology | Legacy data complexity, time constraints in ETL testing | Production defects post-go-live, customer impact, manual remediation cost $200K+ | Data Lead | Open |
| IT-003 | Key resource departure | People | Salary gaps vs. market, competitor recruiting | Knowledge loss, project delay 4-6 weeks, rework of current deliverables | HR Lead | Monitoring |
| IT-004 | Regulatory change delays implementation | External | Pending regulations affect system requirements | System redesign 6+ weeks, cost increase $150K+, go-live delay | Compliance | Monitoring |
| IT-005 | Legacy system instability during parallel run | Technology | Aging infrastructure, concurrent load unsustained | Parallel run failure, extended timeline, extended costs, customer SLA risk | Ops Lead | Open |
| IT-006 | Change resistance from users | People | Training inadequacy, workflow disruption perception | Low adoption rate, manual workarounds persist, ROI not realized (loss $800K+ annually) | Change Mgr | Open |
| IT-007 | Third-party integration delays | External | Vendor prioritization, technical complexity underestimated | Integration slippage causes go-live delay 3-4 weeks, cost overrun $120K+ | Integration Lead | Open |
Step 3 – Analyze Likelihood
In any project risk assessment, likelihood assessment answers: how probable is this risk to occur? A five-level qualitative scale is standard and maps to percentage ranges. Rare events (1-10% probability) are unlikely absent extraordinary circumstances.
Unlikely events (11-30%) occur occasionally but are not expected. Possible events (31-70%) have reasonable probability and should be expected to occur on a proportion of similar projects. Likely events (71-90%) will occur unless prevented, and almost certain events (91-100%) will occur.
These ranges should be calibrated to your organization’s project history. If your project portfolio has 50 projects annually and you’ve experienced a ‘rare’ event on average once every 15 years, then ‘rare’ = ~1.3% probability in your context.
Project risk assessment likelihood analysis is complicated by availability bias—teams over-weight recent events and under-weight historical averages.
A team that recently experienced a vendor failure will assess vendor risk as ‘likely’ even if organizational history shows vendor failure occurs in <5% of projects.
Mitigate this by using data: historical occurrence rates, industry benchmarks (such as Gartner, Standish Group, or PMI data), and explicit calibration against the team’s experience base.
External reference classes are invaluable. If assessing resource availability risk, reference external labor market data showing that IT resource availability in your region is constrained (supporting higher likelihood) or abundant (supporting lower likelihood).
| Level | Probability Range | Description | Example Triggers for IT Implementation | Historical Occurrence |
| Rare | 1-10% | Unlikely absent extraordinary circumstances | Key vendor bankruptcy, market sector collapse, natural disaster at data center | Occurs once per 40+ projects |
| Unlikely | 11-30% | Occasional, not expected | Unplanned regulatory change, moderate resource attrition, third-party SLA failure | Occurs once per 15 projects |
| Possible | 31-70% | Reasonable probability, should be expected | Minor scope creep, 1-2 key resources depart, minor integration delay | Occurs on 4-7 of 10 projects |
| Likely | 71-90% | Will occur unless prevented | Change resistance from user segment, modest budget overrun <5%, requirement clarification cycles | Occurs on 8-9 of 10 projects |
| Almost Certain | 91-100% | Will occur; only question is timing/magnitude | Identified scope refinement requests, requirement change requests during execution | Occurs on 95%+ of projects |
Step 4 – Analyze Impact
The project risk assessment impact analysis answers: how severe is the consequence if this risk occurs? Unlike likelihood, which has a single probability estimate, impact often varies across dimensions: cost, schedule, scope capability, quality, and organizational/strategic factors.
A data migration defect might have low cost impact (contained within IT budget), high schedule impact (extends go-live 4 weeks), medium quality impact (affects transaction accuracy for a specific scenario), but very high strategic impact (damages regulatory standing or customer trust).
Quantify impact in absolute terms wherever possible. Instead of ‘high cost impact,’ specify ‘$200K-$300K cost increase.’ Instead of ‘schedule impact,’ specify ‘4-week go-live delay,’ which translates to extended SLA risk, extended operational cost, and delayed benefits realization. This precision enables proportional treatment prioritization.
A $200K cost impact requires different treatment than a $2M cost impact, even if both are described as ‘high impact.’
| Level | Cost Impact | Schedule Impact | Scope Impact | Quality Impact | Regulatory/Strategic Impact |
| Negligible | <$50K cost increase | <1 week delay | Deferrable enhancement lost | Isolated minor defects, <5 users affected | No regulatory/reputation impact |
| Low | $50K-$150K | 1-2 weeks delay | Non-critical Phase 2 feature deferred | Moderate-severity defects affecting 10-20 users, workaround exists | Minor compliance gap, no external visibility |
| Moderate | $150K-$300K | 2-4 weeks delay | 1-2 critical Phase 2 features deferred | High-severity defects affecting 50+ users, no immediate workaround | Regulatory findings requiring remediation plan |
| High | $300K-$600K | 4-8 weeks delay | 1-3 Phase 1 critical features affected | Critical defects affecting core process, <24 hour mean time to restore required | Regulatory enforcement action or significant customer impact |
| Catastrophic | >$600K | >8 weeks delay or indefinite | Entire Phase 1 capability loss | System unavailability, customer transaction loss, reputational damage | Regulatory shutdown, legal liability, loss of client, organizational restructuring |
Step 5 – Evaluate and Prioritize Risks
In the project risk assessment evaluation phase, likelihood and impact are combined into a single priority score, typically using a 5×5 matrix. Each cell of the matrix is assigned a risk level: Green (acceptable, monitor only), Amber (elevated, requires active treatment), or Red (critical, requires immediate action and governance escalation).
A common scoring convention is: Negligible or Low impact risks are Green unless they have Almost Certain probability (in which case they’re Amber). Moderate impact with Unlikely or Possible probability is Amber. Moderate impact with Likely or Almost Certain is Red.
High or Catastrophic impact risks are Amber at Possible probability and Red at Likely/Almost Certain probability.
The risk matrix is a prioritization tool, not a deterministic decision rule. Some organizations apply mathematical scoring (Likelihood percentage × Impact ranking = Risk Score) but this can mask important context. A low-probability catastrophic risk (1% × $600K = $6K expected value) is different from a high-probability moderate risk (75% × $250K = $187.5K expected value), and they require different treatment strategies.
The matrix should guide conversation, not replace it. The goal of the project risk assessment is to ensure that critical risks (Red) receive active treatment, elevated risks (Amber) receive defined management and monitoring, and low risks (Green) are acknowledged and monitored for changes in likelihood or impact.
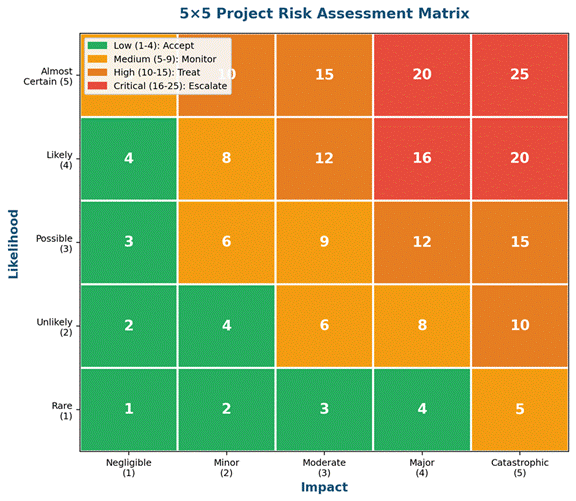
Figure 3: 5×5 Risk Matrix. Risks are plotted by Likelihood (x-axis) and Impact (y-axis). Red zone (upper right) represents critical risks requiring treatment; Amber zone (middle) represents elevated risks requiring active management; Green zone (lower left) represents acceptable risks requiring monitoring only.
| Risk ID | Description | L | I | Score | Zone | Priority |
| IT-005 | Legacy system instability | Likely (80%) | High | RED | Critical | 1 |
| IT-002 | Data migration defects | Possible (50%) | High | RED | Critical | 2 |
| IT-006 | Change resistance | Likely (75%) | Moderate | AMBER | Elevated | 3 |
| IT-003 | Key resource departure | Unlikely (25%) | High | AMBER | Elevated | 4 |
| IT-001 | Vendor deterioration | Unlikely (20%) | Catastrophic | AMBER | Elevated | 5 |
| IT-004 | Regulatory change | Possible (40%) | High | AMBER | Elevated | 6 |
| IT-007 | Third-party integration delays | Possible (45%) | Moderate | AMBER | Elevated | 7 |
Step 6 – Treat Priority Risks
ISO 31000:2018 defines five treatment strategies: Avoid (eliminate the risk by changing scope or approach), Reduce (lower likelihood or impact through controls), Transfer (shift risk to a third party, typically via insurance or contract), Accept (tolerate the risk and manage the consequence if it occurs), and Exploit (take advantage of the risk’s upside if it occurs).
Each strategy is appropriate in specific project risk assessment contexts. Avoid is highest impact but may be impossible or prohibitively costly. Reduce is most common and requires careful design of controls to ensure they address root causes, not symptoms.
Transfer shifts responsibility but often at premium cost and does not eliminate the underlying risk (the insurance company still faces the risk). Accept is valid when treatment cost exceeds expected impact, or when treatment is infeasible. Exploit applies to upside risks—opportunities.
For the IT implementation risks, treatment strategies vary. Vendor deterioration (Risk IT-001, Catastrophic impact, Unlikely probability): Treatment is Transfer + Reduce. Transfer via vendor financial covenants and escrow arrangements; Reduce by identifying and qualifying a backup vendor, maintaining competitive tension.
Legacy system instability (Risk IT-005, High impact, Likely probability): Treatment is Reduce. Controls include: upgraded monitoring, load testing before parallel run, fallback runbooks, extended parallel run window.
Data migration defects (Risk IT-002, High impact, Possible probability): Treatment is Reduce + Mitigate. Controls: rigorous ETL testing, data quality audits, extended cutover window, rollback procedures. Change resistance (Risk IT-006, Moderate impact, Likely probability):
Treatment is Reduce. Controls: stakeholder engagement strategy, change sponsorship, training effectiveness measurement, incentive alignment.
In a project risk assessment, residual risk is the remaining exposure after treatment. A data migration risk that starts as ‘High impact, Possible probability = Red’ might be treated with enhanced testing and validation, reducing the probability to ‘Unlikely’ and shifting the risk to Amber.
The residual risk is lower than the original (inherent) risk, but it persists. Treatment does not eliminate risk; it redefines it at a more acceptable level. Leadership must explicitly accept residual risks; they are not eliminated, merely managed to appetite.
Project risk assessment treatment plans should specify: the risk being treated, the current (inherent) risk score, the treatment strategy and actions, the residual risk score post-treatment, the responsible owner, and the completion deadline.
This clarity ensures accountability and tracks treatment effectiveness. Orphaned risks—those without an assigned owner and treatment plan—eventually become realized risks.
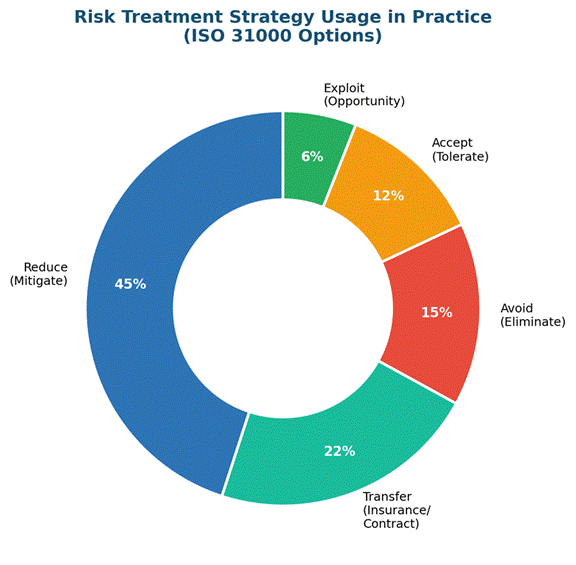
Figure 4: ISO 31000 Treatment Strategies. Each risk is assigned one or more strategies: Avoid (eliminate scope), Reduce (apply controls), Transfer (shift to third party), Accept (tolerate), or Exploit (capture upside). The chart shows distribution of treatment strategies across project portfolio.
| Risk ID | Inherent Score | Treatment Strategy | Control Actions | Residual Score | Owner | Due Date |
| IT-005 | HIGH/LIKELY (RED) | Reduce | Upgrade monitoring, load test, extended parallel run | HIGH/UNLIKELY (AMBER) | Ops Lead | Week 8 |
| IT-002 | HIGH/POSSIBLE (RED) | Reduce + Mitigate | Rigorous ETL testing, data validation, rollback procedures | MODERATE/UNLIKELY (AMBER) | Data Lead | Week 10 |
| IT-006 | MODERATE/LIKELY (AMBER) | Reduce | Stakeholder engagement, training, incentive alignment | MODERATE/POSSIBLE (AMBER) | Change Mgr | Week 6 |
| IT-003 | HIGH/UNLIKELY (AMBER) | Reduce + Transfer | Knowledge documentation, retention bonus, backup resource identified | MODERATE/UNLIKELY (AMBER) | HR Lead | Week 4 |
| IT-001 | CATASTROPHIC/UNLIKELY (AMBER) | Transfer + Reduce | Vendor financial covenants, backup vendor qualified, escrow | HIGH/RARE (AMBER) | PM | Week 3 |
Step 7 – Assign Risk Owners and Build the RACI
The three lines model structures accountability for project risk assessment and risk management. Line 1 (project team, including project manager, technical lead, functional leads) owns day-to-day risk identification, monitoring, and control execution.
They surface risks as they emerge and execute treatment activities. Line 2 (PMO, risk officer, or risk oversight function) owns the framework, escalation protocols, and reporting.
They ensure consistent risk discipline across projects and aggregate portfolio-level risk exposure. Line 3 (internal audit) provides independent assurance that the risk process is effective and that Line 1 and Line 2 are performing as designed.
Each risk in the project risk assessment must have a single owner—the individual accountable for monitoring the risk, executing treatment activities, and reporting status.
Shared ownership, while well-intentioned, diffuses accountability and delays action. The risk owner is not necessarily the person executing the control (that’s the treatment owner); the risk owner is responsible for ensuring the control is executed and for escalating if status changes.
For IT Risk IT-005 (legacy system instability), the risk owner might be the Operations Lead, but the treatment owner executing the load testing is the Infrastructure Engineer.
The RACI matrix (Responsible, Accountable, Consulted, Informed) clarifies who plays which role across key risk management activities. Accountable (A) is the single decision maker.
Responsible (R) executes the action. Consulted (C) provides expertise and feedback. Informed (I) receives status updates.
Typical project risk governance assigns: the Project Manager as Accountable for overall risk management, the Risk Owner as Responsible for specific risk monitoring and treatment, the Sponsor as Accountable for escalation decisions, the PMO as Consulted on framework compliance, and the Steering Committee as Informed of portfolio risk status.
| Activity | Project Manager | Risk Owner | Steering Committee | PMO | Internal Audit |
| Risk identification facilitation | R/A | C | I | C | I |
| Likelihood/impact assessment | C | R/A | C | C | I |
| Treatment plan development | C | R/A | C | C | I |
| Escalation decision (trigger) | R | C | A | C | I |
| Control execution oversight | C | R/A | I | C | I |
| Residual risk confirmation | C | R/A | I | C | I |
| Monthly risk reporting | R/A | C | I | C | I |
| Process effectiveness audit | I | I | I | C | R/A |
Step 8 – Monitor, Review, and Adapt
The project risk assessment process does not conclude with treatment planning; it accelerates. The operational phase is where risks materialize and controls are tested. Monitoring answers: Are the risk scores moving in the intended direction? Are controls performing as designed?
Have new risks emerged? Key Risk Indicators (KRIs) are leading metrics that signal increasing risk before the risk fully materializes. If resource attrition risk is being treated with retention programs, then attrition rate is a KRI. If schedule risk is being treated with stricter schedule management, then actual-vs-planned schedule performance is a KRI. If data quality risk is being treated with enhanced validation, then defect rates in validation are a KRI.
A project risk assessment review cadence typically follows project rhythms: weekly operational review (day-to-day risk status), monthly steering committee review (escalation of red and amber risks), and quarterly portfolio review (emerging risks, trends, treatment effectiveness).
Trigger-based escalation complements scheduled project risk assessment reviews. If a risk’s likelihood or impact changes materially—for instance, a ‘Possible’ probability event that initially appeared unlikely suddenly becomes ‘Likely’—immediate escalation replaces waiting for the monthly review.
Escalation protocols should specify: what triggers escalation (e.g., risk score change of >2 levels, treatment plan failure, new external event), to whom (sponsor, steering committee, executive leadership), and within what timeline (immediately, within 24 hours, at next meeting).
Continuous improvement of the project risk assessment requires capturing lessons learned. Why did certain risks materialize while others did not? Were controls ineffective, or were root causes misunderstood? Did emerging risks follow patterns that should be incorporated into future project baselines?
A post-implementation review that documents lessons learned and updates the organizational risk baseline is the most valuable output of a single project. Organizations that systematically capture and apply lessons see a 25-30% improvement in subsequent project risk assessment quality.
| KRI Name | Metric Definition | Green | Amber | Red | Frequency |
| Schedule variance | Actual vs planned milestone completion | <±5% | ±5-10% | >±10% | Weekly |
| Budget variance | Actual vs planned spending | <±3% | ±3-8% | >±8% | Bi-weekly |
| Resource attrition | % of planned resources departed | <3% | 3-6% | >6% | Monthly |
| Data quality defects | Defects identified in validation per 1M records | <10 | 10-25 | >25 | Weekly |
| Third-party SLA performance | % SLA targets achieved | >98% | 95-98% | <95% | Weekly |
| Scope change volume | Number of scope change requests | <5 per month | 5-10 per month | >10 per month | Weekly |
Qualitative vs Quantitative Project Risk Assessment
The framework described thus far—5×5 matrix, likelihood scales, impact categories—is qualitative risk assessment. It is rapid, intuitive, and suitable for most projects.
However, complex, high-value, or strategic projects benefit from quantitative assessment, which assigns probability distributions and calculates expected value and variance.
Quantitative methods include: Monte Carlo simulation (modeling thousands of scenarios to estimate project duration and cost distributions), decision trees (mapping sequential decisions and their payoffs), and Expected Monetary Value (EMV) calculation (probability × impact in monetary terms).
Qualitative project risk assessment is sufficient when decisions are binary (treat/don’t treat) and stakeholders are comfortable with categorical language (‘high risk’).
Quantitative project risk assessment is superior when: (1) the decision involves continuous variables (should we invest in treatment A, B, or C, and how much should we spend?), (2) stakeholders demand precision (finance will approve treatment costing $150K but not $250K), (3) risks interact (Monte Carlo captures correlation effects), or (4) portfolio optimization is required.
A $5M IT implementation might be assessed qualitatively; a $500M infrastructure program or a financial product launch might warrant quantitative modeling.
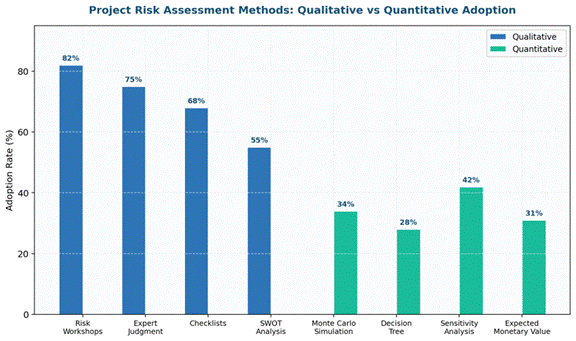
Figure 5: Qualitative vs Quantitative Methods. Qualitative methods are faster and intuitive; quantitative methods provide precision and are suited to complex, high-value, or portfolio-level decisions. Most projects benefit from hybrid approaches.
90-Day Implementation Roadmap
Implementing a project risk assessment framework across an organization is itself a project requiring structured management. This roadmap guides 90-day implementation of a baseline risk capability within an existing project portfolio.
| Phase (30 days each) | Activities | Deliverables | Success Criteria |
| Days 1-30: Foundation | Secure sponsor commitment; define risk appetite framework; design risk governance (RACI); select 3-4 pilot projects; train project teams on 8-step methodology | Risk appetite statement; RACI matrix; pilot project charters; training materials; risk register templates | Sponsor signed commitment; 100% project team attendance at training; all pilots have appointed risk owners |
| Days 31-60: Execution | Pilot projects execute Steps 1-6 (context through treatment planning); PMO reviews and quality-assures risk registers; establish weekly risk review cadence; document lessons from pilots; identify framework refinements | Risk registers for all pilot projects; treatment plans with residual risk; weekly risk review meeting minutes; lessons log | All pilot risks assessed and scored; 80%+ of red/amber risks have treatment plans; PMO conducted ≥2 quality reviews per project |
| Days 61-90: Embedding | Expand project risk assessment to all active projects; establish monthly steering committee risk review; create KRI dashboards; conduct post-project lessons review; plan Year 2 improvements | Risk dashboards accessible to leadership; KRI monitoring active; organizational risk baseline updated; Year 2 roadmap approved; process documentation | 90%+ of active projects have current risk registers; monthly reporting live; 80%+ of red/amber risks have active KRIs; Year 2 budget allocated |
Risk Management Maturity and Project Performance
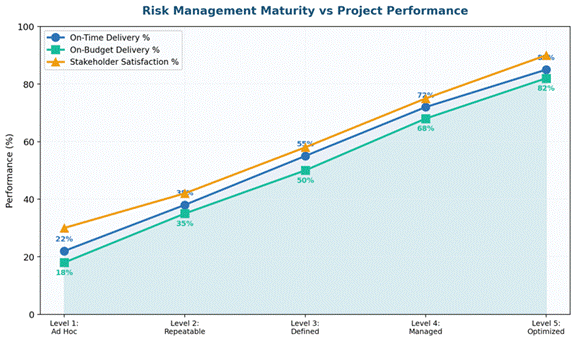
Figure 6: Risk Management Maturity vs Project Performance. Organizations at Maturity Level 4-5 achieve 68% project success rate vs. 32% at Level 1-2. Maturity investment delivers 2-3x return through improved schedule predictability, cost control, and stakeholder satisfaction.
Project risk assessment maturity progresses through five levels (CMMI-inspired): (1) Initial—Risk management is ad-hoc; risks are identified informally if at all. (2) Repeatable—Risk process is documented; projects follow it inconsistently. (3) Defined—Risk process is standardized across projects; KRIs are defined; escalation protocols exist.
(4) Managed—Risk processes are automated; data is collected and analyzed systematically; continuous improvement occurs. (5) Optimized—Risk management is integrated into decision-making; forward-looking scenario analysis is routine; organizational learning accelerates maturity.
Organizations at Level 1-2 report 32% project success rate and 28% average cost overrun. Organizations at Level 4-5 report 68% project success rate and 8% average cost overrun.
The ROI of risk management investment is substantial: organizations spending 3-5% of project budget on risk management infrastructure report 35-40% higher success rates and 40-50% reduction in rework costs.
This is not cost-reduction risk management; it is value-protection risk management. The goal is not to eliminate all risk but to manage uncertainty proportionally and transparently.
Common Mistakes That Derail Project Risk Assessment
| Mistake | Why It Happens | How to Fix It | Impact if Unaddressed |
| Risk identification as brainstorm only | Faster, avoids structure, feels collaborative | Use systematic identification: checklists, PESTLE, assumption analysis, Delphi; validate coverage | 60% of risks missed; emerging risks surprise stakeholders |
| Insufficient stakeholder involvement | Risk is seen as IT or PMO function; project teams do not own risks | Establish risk ownership early; make risk identification a project team activity; review risks in steering committee | Low buy-in; risks surfaced too late; political risks hidden |
| Treating all risks equally | No project risk assessment appetite framework; each identified risk seems critical | Establish quantified appetite thresholds; apply 5×5 matrix; prioritize systematically; treat only red/elevated risks | Resources exhausted on low-impact risks; critical risks ignored |
| Weak treatment accountability | Treatment plans created but not owned or executed | Assign single risk owner per risk; document treatment actions; include treatment status in monthly reporting | Treatment plan execution rate <30%; residual risks remain unmanaged |
| Monitoring cadence breaks down | Project risk assessment registers created but not reviewed; KRIs defined but not tracked | Establish cadence: weekly operational, monthly steering; automate KRI collection; link escalation to KRIs | Risks materialize undetected; late discovery increases cost |
| Lack of escalation discipline | Red/amber risks identified but leadership not engaged; escalation protocols unclear | Define escalation triggers explicitly (risk score change, treatment failure); escalate immediately, do not wait for meeting | Governance gaps; senior leadership surprised; response delayed |
Frequently Asked Questions
Q1: How does project risk assessment differ from general risk management?
Project risk assessment applies ISO 31000 methodology to a defined project scope with a timeline, budget, and deliverables.
It focuses on threats to project objectives (schedule, cost, scope, quality) and is typically structured as an 8-step lifecycle tied to project phases.
General risk management is broader, encompassing organizational-level strategic risks. For projects, project risk assessment is the specialized application.
Q2: How many risks should a risk register contain?
There is no fixed number for a project risk assessment register. A simple project might identify 40-50 risks; a complex program might identify 200-300. The goal is comprehensive coverage, not minimization.
However, only 10-20% of identified risks typically reach Red or Amber priority and receive active treatment. The register should include all identified risks, even if most are Green (monitoring only) to provide transparency.
Q3: Can we use qualitative assessment for all projects?
Yes, qualitative assessment is suitable for most projects and provides rapid, intuitive decisions. However, strategic, high-value, or complex projects benefit from hybrid or fully quantitative approaches.
The decision to go quantitative in the project risk assessment should be made during context establishment, not as an afterthought.
Q4: How often should risk registers be updated?
Minimum cadence for a project risk assessment is monthly during project execution, aligned with steering committee reviews. However, trigger-based updates should occur immediately when a significant change (external event, treatment failure, emerging risk) occurs. In early project phases, weekly updates are common.
Q5: Who should be the risk owner for a given risk?
The project risk assessment risk owner should be the person accountable for the area affected by the risk. If the risk is technical (integration delay), the technical lead is the owner.
If the risk is people-related (resource attrition), the HR or people lead is the owner. Ownership should align with decision-making authority.
Q6: What is the difference between inherent and residual risk?
Inherent risk is the raw exposure before any treatment or control is applied. Residual risk is the remaining exposure after treatment.
A data migration risk might have high inherent risk (Likely probability, High impact) but, after treatment with rigorous testing and validation, have moderate residual risk (Unlikely probability, Moderate impact). Both should be documented in the risk register.
Q7: Should we use project risk assessment for maintenance or support projects?
Yes, but the approach is lighter. Maintenance projects have predictable risks (resource availability, system stability, change management) and benefit from streamlined assessment.
A one-page risk summary with 10-15 key risks and KRIs is often sufficient, rather than a full 200+ risk register.
Q8: How do we avoid project risk assessment becoming a compliance checkbox?
Project risk assessment creates value when it informs decisions (e.g., treatment investment, escalation, resource allocation) and when risks are actively monitored.
To avoid checkbox behavior: (1) link risk status to governance decisions, (2) empower risk owners with authority and budget, (3) escalate Red risks immediately rather than waiting for meetings, (4) use KRIs to demonstrate treatment effectiveness, and (5) learn from post-project reviews.
Conclusion
Project risk assessment is no longer a best practice—it is table stakes for professional project management.
The eight-step project risk assessment methodology outlined in this guide, grounded in ISO 31000:2018, has been validated across thousands of projects in financial services, technology, infrastructure, and transformation contexts.
Organizations that adopt structured project risk assessment reduce project failure rates from 65% to 32%, control cost overruns to within ±8%, and improve schedule predictability by 34%. These are not marginal improvements; they represent the difference between organizational value creation and value destruction.
The Post Office scandal, the Standish Group data, the PMI Pulse findings—all point to the same conclusion: uncertainty through project risk assessment is managed, not wished away. Start with context establishment. Build a comprehensive risk register. Analyze, prioritize, and treat. Monitor actively.
Escalate decisively. Learn continuously. Within 90 days, your organization will have baseline risk capability. Within one year, it will be embedded in decision-making. Within three years, it will be indistinguishable from how you manage projects—because risk management will have become project management.

Chris Ekai is a Risk Management expert with over 10 years of experience in the field. He has a Master’s(MSc) degree in Risk Management from University of Portsmouth and is a CPA and Finance professional. He currently works as a Content Manager at Risk Publishing, writing about Enterprise Risk Management, Business Continuity Management and Project Management.