Lean operation management is the practice of defining value from the customer’s point of view, mapping every step that delivers it, removing the steps that add no value, letting demand pull work through the remaining steps, and repeating the cycle. It grew out of the Toyota Production System and is now applied in factories, hospitals, banks, and government agencies.
On 22 January 2026 GE Aerospace reported that full-year engine deliveries had risen 25% and LEAP deliveries 28%, with revenue up 21%, in its fourth-quarter 2025 results. Chief executive Larry Culp attributed the acceleration to FLIGHT DECK, the company’s lean operating model, against a backlog of roughly $190 billion.
That is the clearest recent example of lean operation management moving output at scale in a US company. The sections below define the method, list the eight wastes, walk through the tools, show a services example, and explain where lean creates risk a manager has to identify early.
| Lean Operation Management: The Bottom Line |
| Lean operation management is the discipline of specifying value from the customer’s view, mapping every step that delivers it, removing the steps that add no value, and repeating that cycle; the Lean Enterprise Institute traces the five-step version to Womack and Jones in 1996. |
| The method rests on the Toyota Production System’s two pillars, jidoka (stop on abnormality) and just-in-time (make only what is needed, when it is needed), which Toyota still describes as the basis of its plants. |
| GE Aerospace reported on 22 January 2026 that FY2025 engine deliveries rose 25% and LEAP deliveries 28% under its FLIGHT DECK lean operating model, against a backlog of about $190 billion. |
| The Bureau of Labor Statistics put US manufacturing productivity growth at 0.1% a year from 2007 to 2019 and 0.4% a year from 2019 to 2025 Q3, against 4.7% a year in 2001 to 2007; lean is the main lever plants have to close that gap. |
| Waste comes in eight forms, remembered as DOWNTIME: defects, overproduction, waiting, non-utilized talent, transportation, inventory, motion, and extra processing. |
| Lean works in services too: Bain’s rule-based credit policy cut a commercial bank’s fast-track approval time by 30% and rework by 25%. |
| Lean removes buffers, so it raises operational and continuity risk unless controls are redesigned alongside it; Boeing’s production cap of 38 aircraft a month from January 2024 to October 2025 is the reference case. |
What Lean Operation Management Means in Practice
The Lean Enterprise Institute defines lean thinking as a five-step thought process proposed by Womack and Jones in 1996: specify value, map the value stream, create flow, establish pull, and pursue perfection. Lean operation management is the daily running of a business on those five steps rather than a one-off improvement project.
| Principle | What it asks | Factory example | Service example |
| 1. Value | Define value from the end customer’s view, by product family | A finished engine that passes test on the first run | A loan decision the applicant can act on |
| 2. Value stream | Map every step; remove those that create no value | Casting to assembly to test, with inspections questioned | Application to approval, with hand-offs counted |
| 3. Flow | Make value-creating steps run in tight sequence | One-piece flow cells in place of batch queues | Same-day file review instead of weekly committees |
| 4. Pull | Let the customer pull work from the upstream step | Kanban cards trigger replenishment | Work released only when the next desk has capacity |
| 5. Perfection | Repeat the cycle and remove root causes | Daily kaizen at the line | Weekly defect review with the credit team |
The method’s parent is the Toyota Production System. Toyota’s own description rests on two pillars: jidoka, which stops a machine or a line the moment an abnormality appears, and just-in-time, which makes only what is needed, when it is needed, in the amount needed. Sakichi Toyoda’s automatic loom supplied the first and Kiichiro Toyoda the second.
The word operation matters. Lean applied to a project ends with the project; lean operation management is the standing system of standard work, daily management, and problem-solving that a plant or branch runs every shift.
The Lean Enterprise Institute’s operations page splits all work into value-added, essential but non-value-added, and waste, and the third category is where the method starts.
Why the Method Still Matters: The Productivity Gap
Lean would be an academic topic if productivity were rising on its own. It is not. The Bureau of Labor Statistics’ Monthly Labor Review of 4 March 2026 reports manufacturing output per hour grew 4.7% a year from 2001 to 2007, then 0.1% a year from 2007 to 2019, and 0.4% a year from 2019 to 2025 Q3.
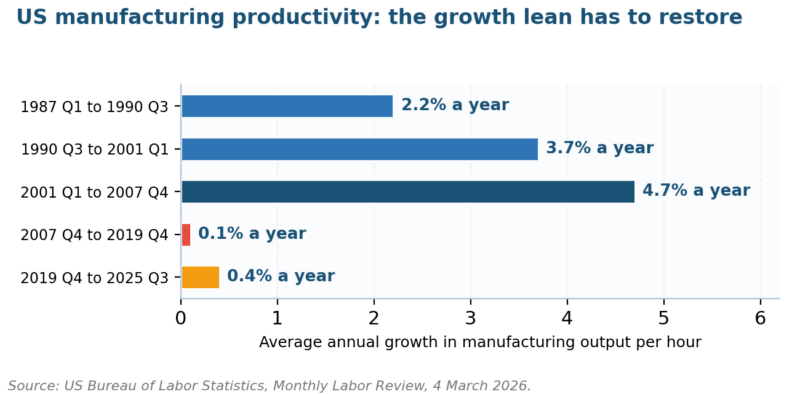
Figure 1. US manufacturing productivity growth fell from 4.7% a year to almost nothing after 2007 and has recovered only to 0.4% a year in the current cycle.
The latest quarter is better. The BLS release of 11 August 2026 shows manufacturing productivity up 0.9% from Q2 2025 to Q2 2026, with output up 1.3% and hours up 0.4%, while unit labor costs rose 3.5%. Costs growing four times faster than productivity is the reason a plant manager maps the value stream.
| Indicator | Figure | Source and date | What lean does about it |
| Manufacturing productivity growth, 2007 Q4 to 2019 Q4 | 0.1% a year | BLS MLR, 4 March 2026 | Removes waiting, motion, and rework that hours-based measures hide |
| Manufacturing productivity growth, 2019 Q4 to 2025 Q3 | 0.4% a year | BLS MLR, 4 March 2026 | Standard work and daily management sustain gains between projects |
| Manufacturing productivity, Q2 2025 to Q2 2026 | +0.9% | BLS TED, 11 August 2026 | Flow and pull convert hours into shipped output |
| Manufacturing unit labor costs, Q2 2025 to Q2 2026 | +3.5% | BLS TED, 11 August 2026 | Overproduction and inventory are the first costs cut |
| MEP National Network client cost savings, FY2024 | $2.6 billion | Senate letter citing NIST MEP, April 2025 | Small manufacturers get lean coaching through the MEP centers |
Small manufacturers reach lean mainly through the NIST Manufacturing Extension Partnership. A Senate letter of April 2025 citing the network’s FY2024 survey put client results at $2.6 billion in cost savings, $15 billion in new and retained sales, and more than 108,000 jobs created or retained. Those are self-reported client figures, and we treat them as directional.
The Eight Wastes Lean Operation Management Removes
Taiichi Ohno named seven wastes for the Toyota Production System; the Lean Enterprise Institute’s lexicon entry lists overproduction, waiting, conveyance, processing, inventory, motion, and correction. Jean Cunningham’s eight wastes article adds unused talent and supplies the DOWNTIME mnemonic most trainers now use.
| Waste | Definition | Factory sign | Office or service sign |
| Defects | Work that fails specification and needs rework or scrap | First-pass yield below target; scrap bins full | Loan files returned for correction |
| Overproduction | Making more, or earlier, than the next step needs | Finished goods waiting for orders | Reports produced that nobody reads |
| Waiting | Idle people or machines between steps | Operators watching a machine cycle | Applications queued for a weekly committee |
| Non-utilized talent | Skills and ideas not used | Operators barred from stopping the line | Front-line staff with no authority to decide |
| Transportation | Moving material that adds no value | Parts trucked between buildings | Files routed through three departments |
| Inventory | Stock beyond what a controlled pull system needs | Weeks of raw material on the floor | Backlog of open tickets |
| Motion | Unnecessary human movement | Walking to find tools or documents | Switching between six screens per case |
| Extra processing | Steps the customer would not pay for | Double inspection after a stable process | Approvals that never change the outcome |
Ohno ranked overproduction as the most dangerous waste because it creates the others: excess stock, extra transport, and hidden defects. That ranking is the practical link to operational risk management. A plant that overproduces hides its quality escapes until the customer finds them, the pattern in most of the operational risk examples we catalogue.
Healthcare has the same eight wastes under different names. A BMC Nursing study of a private emergency department, published 22 April 2025, timed 100 patient journeys and found waiting made up 77.7% of total length of stay, with an average wait of 157.87 minutes. Mark Graban’s 2026 healthcare examples map each waste to a ward.
How GE Aerospace Runs Lean With FLIGHT DECK
FLIGHT DECK is GE Aerospace’s name for its lean operating model, and the company publishes enough numbers to judge it. In its first-anniversary review of 1 April 2025, GE reported that 80% of material shortages at the start of 2024 traced to 15 supplier sites, so it deployed more than 550 engineering and supply chain staff to those sites.
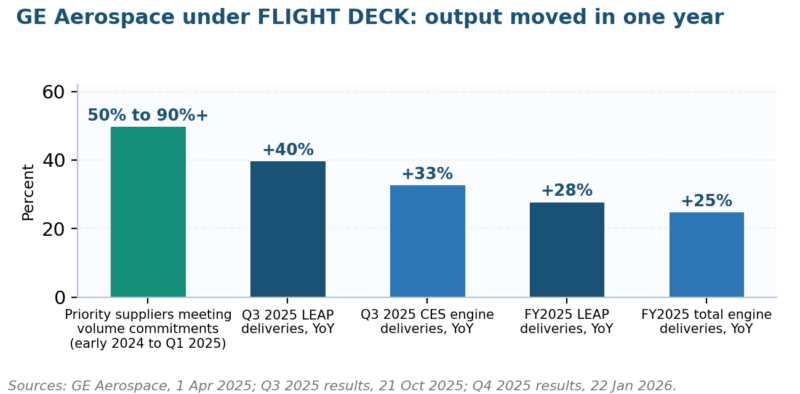
Figure 2. Supplier commitments met rose from about half to more than 90%, and engine deliveries followed through 2025.
The results arrived in sequence. Suppliers meeting volume commitments rose from about 50% in early 2024 to more than 90% a year later, and material input at those sites rose 26% within 2024. By the third quarter of 2025, LEAP deliveries were up 40% year on year and commercial engine deliveries up 33%.
| FLIGHT DECK element | Lean principle applied | Reported figure | Source and date |
| Priority supplier deployment | Value stream extended past the factory gate | 550+ staff to 15 sites causing 80% of shortages | GE Aerospace, 1 April 2025 |
| Supplier volume commitments | Flow: remove the upstream constraint first | About 50% to 90%+ of commitments met | GE Aerospace, 1 April 2025 |
| Material input | Pull from the assembly line | +26%, H1 to H2 2024 | GE Aerospace, 1 April 2025 |
| LEAP deliveries | Flow at the final assembly step | +40% YoY in Q3 2025; +28% for FY2025 | GE Aerospace, 21 Oct 2025 and 22 Jan 2026 |
| Safety, quality, delivery, cost | Perfection, in that order of priority | Stated sequence of the operating model | GE Aerospace, Q3 2025 results |
In its results statements GE lists its priorities as safety, quality, delivery, and cost in that order, the sequence a risk manager would choose. It also treated suppliers as part of the value stream, the lesson behind our critical supplier tiering and supplier performance guides, and behind how we evaluate suppliers.
The Core Tools and What Each One Costs
Tools are the visible part of lean operation management and the part most often bought without the system behind it. The table gives each tool the same treatment: what it does, the strongest benefit we see in practice, and the failure mode that shows up when it is installed without daily management.
| Tool | What it does | Main benefit | Main failure mode |
| Value stream mapping | Draws every step, queue, and hand-off with times | Shows where waiting dominates lead time | Map drawn once, never re-walked |
| Kanban | Cards or signals that release work only when the next step has capacity | Caps work in progress; exposes bottlenecks | Card limits ignored under schedule pressure |
| Kaizen events | Three- to five-day focused improvement with a cross-functional team | Fast, visible change on one process | Production stops, burnout, short-term fixes not sustained |
| 5S | Sort, set in order, shine, standardise, sustain | Motion and search time fall; abnormalities become visible | Becomes housekeeping theatre without the fifth S |
| Visual management | Boards, andon lights, colour codes at the point of work | Deviations seen within minutes | Analog boards not integrated with digital data |
| Total productive maintenance | Operators own routine maintenance and equipment condition | Unplanned downtime falls | Treated as a maintenance department project |
Of the six, kanban needs the most caution. Its benefit is a hard cap on work in progress, which is exactly what teams remove when a customer escalates, and that cap is the control measure; without it the board is a to-do list. ASME’s summary of the five principles makes the same point about pull.
A kaizen event delivers visible change in a week, but production stops for that week, people leave regular tasks, and short-term fixes pile up. We recommend them for a single bottleneck with a named owner, and daily kaizen for everything else. MoreSteam’s eight-wastes toolbox is a sound starting reference for the event team.
Lean Outside the Factory: A Commercial Bank Example
The original version of this article promised lean for financial institutions and gave no example. Bain’s published commercial bank client result fills the gap. The bank’s growth was blocked by credit approval, with problems spread across sales, front-line approval teams, and the central credit group.
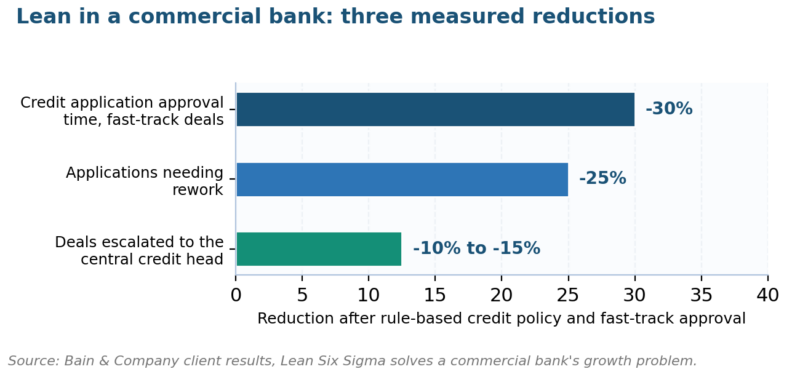
Figure 3. Rule-based credit policy and a fast-track approval path cut approval time by 30% and rework by 25%.
The fix was rule-based credit policy with an accelerated approval path that pushed decisions to the front line. Fast-track approval time fell 30%, applications needing rework fell 25%, and deals escalated to the central credit head fell 10% to 15%. Every one of those is a DOWNTIME waste removed: waiting, defects, and extra processing.
| Bank process step | Waste observed | Lean change | Measured effect |
| Front-line credit approval | Waiting for central sign-off on standard deals | Rule-based policy; front line decides within rules | Fast-track approval time -30% |
| Application preparation | Defects returned for correction | Standard checklist and single-point ownership | Rework -25% |
| Central credit review | Extra processing on deals that fit policy | Escalation only outside defined bands | Escalations -10% to -15% |
| Sustainment | Gains decaying after the project | Tracking metrics plus change management | Results tracked by the bank after handover |
The transferable rule is the escalation band. Deals inside policy move without a committee; deals outside it go up with the file. That is the same structure a risk appetite statement gives a risk function, and the same logic our incident management process guide uses for severity tiers.
Where Lean Meets Risk: The Boeing Lesson
Lean removes the buffers a business continuity management program relies on to absorb shocks. Boeing’s 737 MAX line is the reference case: after the door-plug event of January 2024, the FAA capped production at 38 aircraft a month until 17 October 2025, when inspectors cleared an increase to 42 after extensive inspections of the assembly system.
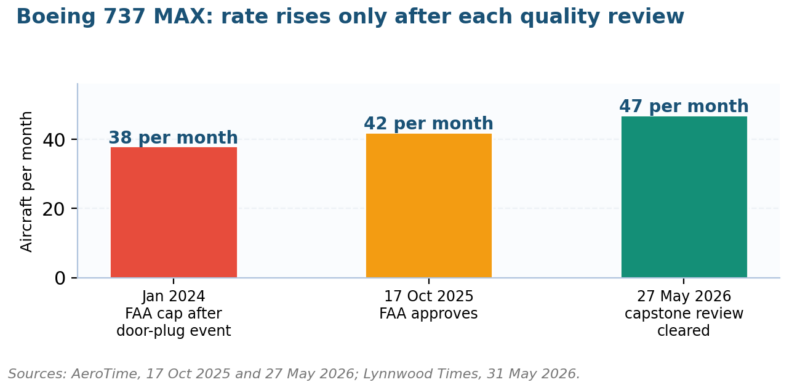
Figure 4. Boeing’s rate rose in steps of five aircraft a month, each step released only after an FAA quality and safety review.
Chief executive Kelly Ortberg said Boeing would raise output five aircraft at a time with an FAA review at each step, and on 27 May 2026 the capstone review cleared the move to 47. The Lynnwood Times reported that Boeing had been hiring about 140 factory workers a week since April 2026 to support it.
| Lean choice | Risk it creates | Control that pairs with it | Standard or guide |
| Just-in-time supply | A single supplier outage stops the line within days | Supplier tiering, dual sourcing on critical parts, buffer stock by risk class | ISO 22301; critical supplier tiering |
| Rate increases | Quality escapes rise faster than inspection capacity | Gate each step on first-pass yield and escape data | FAA rate reviews; ISO 9001 clause 8 |
| Removed inspection steps | Latent defects reach the customer | Jidoka: stop on abnormality; statistical process control | TPS; ISO 9001 |
| Lower work in progress | No slack when demand spikes | Kanban limits agreed with sales; documented surge plan | Business impact analysis |
| Andon and stop authority | Frequent stops if root causes are not fixed | Daily problem-solving with closure tracking | ISO 31000 monitoring and review |
Our position is that lean and risk management are one discipline seen from two sides. Jidoka is a control; the andon cord is an escalation trigger; a kanban limit is a risk appetite. Running one without the other is what breaks, and the business impact analysis is where the two meet, because it prices the buffer lean wants to remove.
For regulated sectors the pairing is mandatory. A pharmaceutical line applying lean has to keep risk-based process validation intact, a device maker keeps medical device risk management under ISO 14971, and both keep the quality risk management record that shows why an inspection step was removed.
Frequently Asked Questions About Lean Operation Management
What is lean operation management in simple terms?
Lean operation management is running a business so that every step either creates value the customer will pay for or is removed. It uses five principles from Womack and Jones (value, value stream, flow, pull, perfection) and the Toyota Production System’s two pillars, jidoka and just-in-time, to cut waste and lead time.
What are the five principles of lean operation management?
Specify value from the customer’s view, map the value stream and remove non-value steps, make the remaining steps flow, let the customer pull work through them, and pursue perfection by repeating the cycle. The Lean Enterprise Institute dates the five-step version to Womack and Jones in 1996 and later condensed it to purpose, process, and people.
Which wastes does lean operation management target?
Eight, remembered as DOWNTIME: defects, overproduction, waiting, unused (non-utilised) talent, transportation, inventory, motion, and extra processing. Taiichi Ohno named the first seven for Toyota and ranked overproduction as the most dangerous because it generates the others; unused talent was added as lean spread beyond manufacturing.
Does lean operation management work outside manufacturing?
Yes. Bain’s commercial bank engagement cut fast-track credit approval time by 30% and rework by 25% through rule-based policy and front-line authority. A BMC Nursing study published in April 2025 found waiting made up 77.7% of emergency department length of stay, which is the same waiting waste a factory maps.
How does lean operation management differ from Six Sigma?
Lean removes waste and shortens lead time by improving flow; Six Sigma reduces variation and defects through statistical analysis of a defined problem. Most programmes combine them, as Bain did for the bank, using lean to fix the process shape and Six Sigma to stabilise the steps that remain.
What risks does lean operation management introduce?
Lean removes inventory, inspection, and slack, so a supplier outage, a demand spike, or a quality escape hits faster. Boeing’s 737 MAX production was capped at 38 aircraft a month from January 2024 to October 2025 while quality controls were rebuilt. Pair each lean change with a control, a trigger, and a business impact analysis.
Where Lean Operation Management Programs Break Down
| Pitfall | Root cause | Remedy |
| Tools bought, system missing | Kanban boards and 5S audits without daily management | Install standard work and a daily tiered meeting before any tool |
| Value stream stops at the factory gate | Suppliers treated as outside the process | Map to tier-two suppliers; deploy staff where shortages originate, as GE did |
| Kaizen events as the only method | Visible change preferred to sustained change | Reserve events for one bottleneck; run daily kaizen elsewhere |
| Cost first, quality later | Programme sponsored by finance alone | Adopt the safety, quality, delivery, cost order and publish it |
| Buffers removed without controls | Lean run without a risk review | Business impact analysis before each inventory or inspection cut |
| Front line without authority | Non-utilized talent left in place | Stop authority and decision rules pushed to the operator or desk |
| Gains not measured | No baseline for lead time, first-pass yield, or WIP | Set the five KPIs before the first change and report weekly |
The Regulatory and Technology Horizon
Regulators now gate rate increases on lean-style evidence. The FAA’s step-by-step reviews of Boeing, each tied to first-pass yield and escape data, set a template that other safety regulators can copy for pharmaceutical and food lines. Expect quality-management-system audits to ask for the value stream map alongside the procedures.
Since 2024, andon signals, kanban limits, and machine downtime have increasingly fed one dashboard, which closes the disadvantage the original article noted: visual management boards were analog and detached from data. A risk management KPI dashboard built on that feed carries first-pass yield and supplier commitment side by side.
Most programmes still leave decisions above the line, so unused talent stays the eighth waste, and the risk culture that lets an operator stop a line is the same culture that lets a clerk refuse a file. Both need key risk indicators that report stop events as a positive.
If you run operations in a plant, a hospital, or a bank and want a lean programme that a risk committee can sign off, we map the value stream, price the buffers you plan to remove, and pair each change with a control and a trigger. Look through our services, then contact us to schedule the value stream walk.

Chris Ekai is a Risk Management expert with over 10 years of experience in the field. He has a Master’s(MSc) degree in Risk Management from University of Portsmouth and is a CPA and Finance professional. He currently works as a Content Manager at Risk Publishing, writing about Enterprise Risk Management, Business Continuity Management and Project Management.