
To evaluate supplier performance, define five weighted criteria (quality, delivery, cost, responsiveness, and risk and compliance), measure each with a documented KPI, score suppliers on a 1 to 5 scale, and review the weighted total on a fixed cadence. ISO 9001 clause 8.4 requires the criteria, the records, and the re-evaluation; the scorecard is how most teams satisfy it.
At 1:17 p.m. on Friday, March 20, 2026, a fire broke out at Anjeon Industry’s engine-valve plant in Daejeon, South Korea, killing 14 workers and injuring 60. The Korea Times reported that the plant produced more than 70 million engine valves a year, most of them for Hyundai Motor and Kia.
Within a week Kia’s Morning and Ray lines stopped, and by early April Hyundai had halted the Kona, Sonata, and Genesis G80, with partial recovery not expected before June. Anjeon supplied roughly half of the group’s valves at 7.5 million units a month, and only one other domestic manufacturer makes the part.
|
The Bottom Line |
|
Evaluate supplier performance on five weighted criteria (quality, delivery, cost, responsiveness, risk and compliance), score each on a 1 to 5 scale, and review the totals on a fixed cadence. |
|
ISO 9001:2015 clause 8.4 requires documented criteria for evaluation, selection, performance monitoring, and re-evaluation of external providers, plus records of the results and actions. |
|
Gartner reports 62% of SRM practitioners use scorecards, but only 22% include nonoperational metrics such as financial health and compliance; 35% of CPOs can segment critical suppliers by value. |
|
Deloitte’s 2025 CPO survey: 84% of technology-and-talent leaders met their supplier performance plans against 59% of followers. |
|
A single engine-valve supplier fire in Daejeon on March 20, 2026 halted Hyundai and Kia models for months; sole-source exposure is a scorecard criterion, not a footnote. |
|
Resilinc’s EventWatchAI logged 26,225 disruption alerts in 2025, up from 22,522 in 2024, with factory fires the top category for a sixth year. |
Every quality audit Anjeon passed was irrelevant to that loss. The criterion that mattered was concentration, and it was not on the scorecard. This guide sets out how to evaluate supplier performance so that the score reflects the risk of losing the supplier, and not only the quality of last month’s deliveries.
How to Evaluate Supplier Performance: The Five Criteria That Matter
Start with the standard every supplier evaluation is audited against. ISO 9001:2015 clause 8.4 requires an organization to determine and apply criteria for the evaluation, selection, monitoring of performance, and re-evaluation of external providers, and to retain documented information on those activities and any resulting actions. ISMS.online’s clause guide lists the same four verbs.
The clause does not name the supplier performance criteria, so the choice is yours, and we recommend five. Quality, delivery, and cost are the operational three every supplier scorecard already carries.
Responsiveness and risk and compliance are the two that Gartner finds missing: only 22 percent of procurement organizations use scorecards that combine operational and nonoperational metrics.
|
Supplier performance criterion |
What it measures |
Where ISO 9001 clause 8.4 touches it |
|
Quality |
Conformity of delivered goods or services to specification, defect and return rates |
8.4.2 verification activities; 8.4.3 information on requirements |
|
Delivery |
On-time, in-full performance against the agreed date and quantity |
8.4.1 monitoring of performance |
|
Cost |
Price against contract, invoice accuracy, total cost of ownership |
8.4.1 re-evaluation criteria |
|
Responsiveness |
Time to acknowledge, quote, resolve, and communicate change |
8.4.3 communication with external providers |
|
Risk and compliance |
Financial health, concentration, certifications, sanctions, ESG, cyber posture |
8.4.1 criteria based on ability to provide conforming products |
The fifth criterion is the one the Anjeon fire tested. A sole-source supplier with a perfect delivery record still carries a concentration exposure, and the critical supplier identification and tiering method should feed a risk score into the card. Gartner finds only 35 percent of CPOs can segment critical suppliers by value, which is why that score is usually missing.
Evaluation is distinct from selection. Selection happens once, through the four stages of supplier selection and a structured review of vendor proposals; evaluation repeats for as long as the contract runs. Our supplier performance risk management guide covers the scoring model in more depth.
Why Supplier Evaluation Decides Plant Uptime
The criteria matter because the gap between good and poor supplier evaluation shows up in output. Deloitte’s 2025 Global Chief Procurement Officer Survey split respondents into leaders, who invest heavily in technology and talent, and followers.
Eighty-four percent of leaders met or exceeded their supplier performance plans against 59 percent of followers.
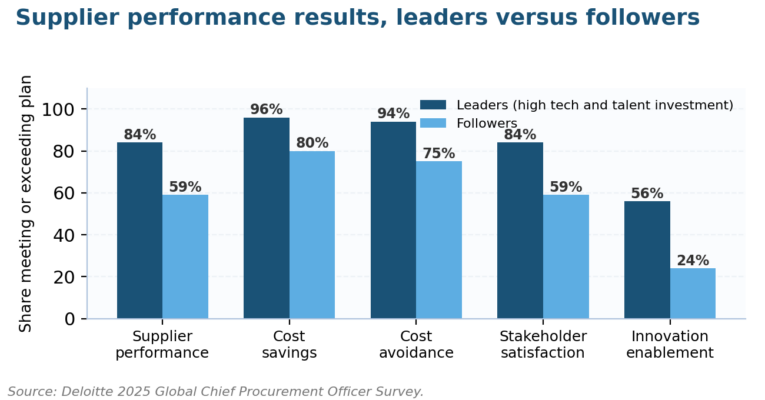
Figure 1. Deloitte’s 2025 CPO survey: the leader-follower gap is 25 points on supplier performance and 32 points on innovation enablement.
The same survey found 74 percent of CPOs rate alternative supply sources as their most effective risk mitigation, 64 percent prioritize supply chain visibility, and 61 percent focus on supplier information sharing. All three depend on a supplier evaluation routine that produces comparable scores across suppliers.
Disruption frequency is rising, which shortens the time a supplier performance score stays accurate. Resilinc’s EventWatchAI issued 22,522 disruption alerts in 2024, a 38 percent increase on 2023, with factory fires the top category at 2,299 alerts. Its Illumination 2025 report put the 2025 count at 26,225.
|
Indicator |
Figure |
Source and date |
|
Leaders meeting supplier performance plans |
84% vs 59% of followers |
Deloitte Global CPO Survey, 2025 |
|
Procurement teams scoring nonoperational metrics |
22% |
Gartner Supplier Relationship Management guide |
|
SRM practitioners using supplier scorecards |
62% |
Gartner Supplier Relationship Management guide |
|
Supply chain leaders with Tier 2 visibility |
42% (95% at Tier 1) |
McKinsey 2025 survey, via Onspring |
|
Disruption alerts issued |
26,225 in 2025; 22,522 in 2024 |
Resilinc EventWatchAI |
|
Procurement workload change for 2026 |
+8% with flat budgets |
Hackett Group 2026 Key Issues Study |
Visibility is the second reason. McKinsey’s 2025 supply chain survey, summarized by Onspring, found 95 percent of leaders have visibility into Tier 1 risk but only 42 percent see Tier 2 or beyond. Hyundai’s exposure to Anjeon was a Tier 1 relationship and still went unmanaged, so the Tier 2 numbers imply a much larger supplier evaluation blind spot.
The US example is smaller. General Motors idled the Bowling Green Corvette plant for the weeks of April 27, May 4, and June 1, 2026 for supplier parts constraints, and GM Authority reported three more down weeks from September 28. Six lost weeks in one year trace back to supplier capacity a supplier performance review should have flagged.
Budgets are not growing to match. The Hackett Group’s 2026 Procurement Key Issues Study reports an 8 percent workload increase against declining headcount and operating budgets, with supply continuity still the top priority.
A supplier scorecard that runs on ERP data is the only evaluation routine that scales under that constraint; the procurement KRI set shows which fields to pull.
The KPIs and Formulas Behind a Supplier Scorecard
With the case made, here are the supplier performance measures. Each criterion needs one or two KPIs with a written formula, a data source, and a target, or the supplier score becomes an opinion. Veridion’s metric guide and APQC’s benchmark definitions agree on the core set below, and the targets come from published buyer requirements where they exist.
|
Supplier performance KPI |
Formula |
Criterion |
Target or benchmark |
|
On-time delivery |
On-time deliveries / total deliveries x 100 |
Delivery |
Walmart prepaid: 90% on time |
|
In-full rate |
Lines delivered in full / total lines x 100 |
Delivery |
Walmart: 95% in full |
|
OTIF |
Orders both on time and in full / total orders x 100 |
Delivery |
APQC top quartile, member data |
|
Defect rate |
Defective units / units delivered x 100 |
Quality |
Below 1% per Veridion |
|
Return rate |
Units returned / units delivered x 100 |
Quality |
Below 1% per Veridion |
|
Price variance |
Invoiced price minus contract price, per line |
Cost |
Zero unapproved variance |
|
Total cost of ownership |
Price + freight + handling + inventory + quality cost |
Cost |
Trend down year on year |
|
Response time |
Hours from query or change request to substantive reply |
Responsiveness |
Set per tier, e.g. 24 hours |
|
Incident frequency |
Quality, delivery, or compliance incidents / orders x 100 |
Risk and compliance |
Falling quarter on quarter |
|
Concentration |
Share of category spend or volume from this supplier |
Risk and compliance |
Flag above 50% with no qualified alternative |
Walmart shows what a hard target looks like. Its on-time, in-full program, summarized by 8th and Walton, sets prepaid suppliers 90 percent on time and 95 percent in full, collect suppliers 98 percent on time, and fines 3 percent of goods cost per missed case. Few buyers need penalties that severe, but every supplier performance target needs a number.
Two rules keep the supplier scorecard KPI list usable. First, count only what the system records without manual effort, because the difference between a KPI and a KRI is that a KRI must be repeatable every period. Second, hold the list to two measures per criterion; the KRI examples library has candidates for each.
Risk and compliance KPIs need outside data. Sanctions screening, certification expiry, financial distress signals, and cyber posture come from sanctions screening, the vendor risk questionnaire, and for software suppliers the SaaS vendor assessment. For ICT suppliers, NIST SP 800-161 Revision 1 supplies the control set for supplier evaluation.
How to Evaluate Supplier Performance With a Weighted Scorecard
Supplier performance KPIs become a decision when weighted and summed. The worked example below scores two machined-parts suppliers on the five criteria with weights of 30, 25, 20, 15, and 10 percent. Each criterion is scored 1 to 5 from its KPIs, multiplied by the weight, and divided by 5 to give a contribution out of 100.
|
Supplier scorecard criterion |
Weight |
Supplier A score |
A contribution |
Supplier B score |
B contribution |
|
Quality |
30% |
4.5 |
27.0 |
3.0 |
18.0 |
|
Delivery |
25% |
4.0 |
20.0 |
2.5 |
12.5 |
|
Cost |
20% |
3.5 |
14.0 |
4.5 |
18.0 |
|
Responsiveness |
15% |
4.0 |
12.0 |
3.0 |
9.0 |
|
Risk and compliance |
10% |
5.0 |
10.0 |
2.0 |
4.0 |
|
Total |
100% |
|
83.0 |
|
61.5 |
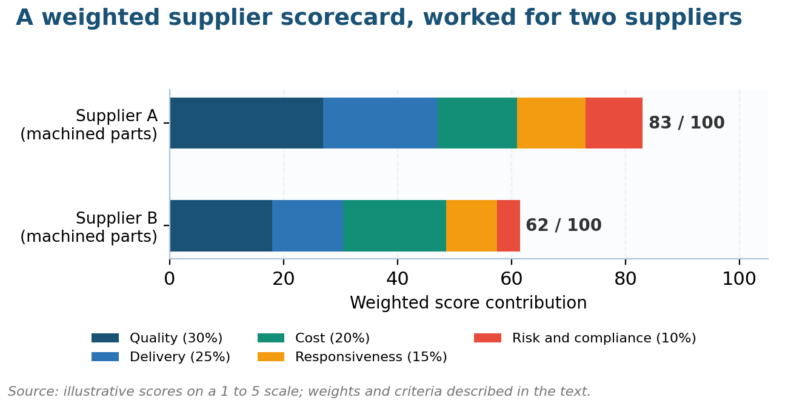
Figure 2. Supplier B wins on cost alone; the weighted supplier scorecard shows why that advantage is worth 4 points out of a 21-point gap.
Supplier B is 1 point better on cost and 21 points worse overall. That is the purpose of weighting: a buyer who compares unit prices picks B, and a buyer who compares supplier scorecards keeps A and negotiates price. Set the weights before scoring, publish them to suppliers, and change them only at contract renewal.
Scoring needs a rubric per criterion, or evaluators disagree by a point. For delivery: 5 for OTIF at 98 percent or above, 4 for 95 to 97.9, 3 for 90 to 94.9, 2 for 80 to 89.9, and 1 below 80. Write one for the other four criteria and store it with the supplier performance software that holds the scores.
Once every supplier has a total, we use three bands for clients: 80 and above is preferred, 65 to 79 is approved with an improvement plan, and below 65 is conditional with a 90-day review. Bands should sit in the risk register as the supplier’s residual rating, and the supply chain risk heat map should plot spend against score.
Not every supplier needs the full card, so segment before you evaluate suppliers. Strategic suppliers get the five-criterion card quarterly, critical but nonstrategic suppliers get it semi-annually with extra weight on financial and compliance metrics, and transactional suppliers get delivery and quality only, once a year.
Audits, Site Visits, and Financial Checks That Verify the Score
A supplier scorecard reports what suppliers did; verification tests whether the data is true and whether tomorrow’s performance is at risk. ISO 9001 clause 8.4.2 asks the buyer to decide the type and extent of control, and Core Business Solutions’ clause guide lists on-site inspection and sample testing as the usual methods. ASQ’s supplier quality resources add the audit programme.
|
Verification method |
What it checks |
Cadence |
Best for |
|
Incoming inspection and sample testing |
Conformity of delivered lots to specification |
Per lot or skip-lot |
Quality-critical components |
|
Process audit (on site) |
Process controls, calibration, training, change management |
Annual for strategic; on trigger |
Manufacturing suppliers |
|
System audit against ISO 9001 or IATF 16949 |
Certification status and scope, nonconformity closure |
At renewal |
All certified suppliers |
|
Financial health review |
Credit rating, days payable, going-concern signals, ownership changes |
Semi-annual |
Sole-source and high-spend suppliers |
|
Business continuity review |
Second site, recovery time, inventory buffer, fire and flood exposure |
Annual |
Sole-source and long lead-time parts |
|
Sustainability and ethics assessment |
ISO 20400 alignment, labor, emissions, EcoVadis or equivalent rating |
Annual |
Regulated or reputationally exposed categories |
Anjeon exposes the business continuity review. A single site with 7.5 million units of monthly output and no qualified second source is a known condition before any fire, and a concentration risk review documents it. Score it under risk and compliance, and the supplier performance total drops before the loss, when there is still time to qualify an alternative.
Financial checks catch the slow failures. A supplier stretching payables, losing its second-largest customer, or changing ownership will usually show it in public filings or credit data months before deliveries slip. Pair the review with fourth-party mapping, because the supplier’s own sole sources are your exposure too, and the concentration risk guide sets the thresholds.
Sustainability belongs in the card where the category demands it. ISO 20400 gives the sustainable procurement framework, and EcoVadis ratings are the most common third-party evidence. Weight it lightly for a machined-parts supplier and heavily for apparel or agriculture, and record the reasoning.
Turning Scores Into Action Plans and Supplier Development
The review meeting turns findings into commitments. Every supplier evaluation below the preferred band produces a written action plan with an owner on each side, a measurable target, and a date. Ivalua’s guide frames this as the third phase of supplier performance management, after setting KPIs and monitoring, and it is the phase most supplier performance programs skip.
|
Action item |
Owner |
Due |
Evidence of closure |
|
Raise OTIF from 91% to 95% |
Supplier logistics lead |
90 days |
Three consecutive months at or above 95% |
|
Cut defect rate from 2.1% to under 1% |
Supplier quality manager |
120 days |
Incoming inspection data, two consecutive months |
|
Qualify a second production site or alternate supplier |
Buyer category manager |
180 days |
First article approval from the alternate |
|
Close 4 open audit nonconformities |
Supplier quality manager |
60 days |
Corrective action reports accepted by buyer |
|
Publish 24-hour acknowledgement standard |
Supplier account manager |
30 days |
Response-time KPI in next quarter’s card |
Meeting cadence follows the segment. Strategic suppliers meet quarterly with the supplier scorecard, the action plan, and a forward look at demand; critical suppliers semi-annually; transactional suppliers annually by email unless a score drops a band. Some events justify an immediate review whatever the calendar, and the list below is the one we build into client procedures:
- A score falling one band, or any single criterion scoring 2 or below
- A safety, environmental, or regulatory incident at the supplier
- Loss of a certification, a failed audit, or an unresolved nonconformity past its due date
- A change of ownership, a credit downgrade, or late payment of the supplier’s own vendors
- A fire, flood, strike, or cyber incident at any site that makes your part
Feedback runs both ways. Suppliers score buyers on forecast accuracy, payment timeliness, and change frequency, because a buyer who pays 30 days late and changes specifications weekly is causing the delivery misses on the supplier scorecard. The operations KRI set and the operational risk management framework hold the buyer-side measures.
Development is the reward for good supplier performance scores. Preferred suppliers get longer contracts, early involvement in design, and access to the supplier diversity and innovation programmes; the enterprise supplier risk management program post describes how those incentives are governed. The documents that leave the review meeting are short:
- The signed supplier scorecard with the rubric version used
- The action plan with owners, dates, and evidence of closure
- The risk register entry with the updated residual rating
- The next review date and the trigger list
Questions Practitioners Ask About How to Evaluate Supplier Performance
What is the best way to evaluate supplier performance?
The best way to evaluate supplier performance is a weighted scorecard built on five criteria: quality, delivery, cost, responsiveness, and risk and compliance. Score each from one or two documented KPIs on a 1 to 5 scale, apply weights agreed before scoring, and review the total against published bands on a cadence set by the supplier’s segment.
Which KPIs should I use to evaluate supplier performance?
Use on-time delivery, in-full rate, defect rate, return rate, price variance, total cost of ownership, response time, incident frequency, and concentration share to evaluate supplier performance. Ten KPIs at most, each with a written formula and a system data source. Add sustainability or cyber measures only where the category carries that exposure.
How often should you evaluate supplier performance?
Evaluate supplier performance quarterly for strategic suppliers, semi-annually for critical but nonstrategic suppliers, and annually for transactional ones. Run an immediate review when a score drops a band, a certification lapses, ownership changes, or a site suffers a fire, flood, strike, or cyber incident. ISO 9001 clause 8.4 requires re-evaluation but leaves the interval to you.
Does ISO 9001 require you to evaluate supplier performance?
Yes. ISO 9001:2015 clause 8.4.1 requires criteria for the evaluation, selection, monitoring of performance, and re-evaluation of external providers, and documented information on the results and any actions. Certification auditors ask for the criteria, the scores, and the action records, so a scorecard with a rubric is the simplest way to evaluate supplier performance under the standard.
How do you evaluate supplier performance for a sole-source supplier?
Evaluate a sole-source supplier on the same five criteria, but weight risk and compliance higher and add a business continuity review: second site, recovery time, inventory buffer, and hazard exposure. Score concentration explicitly. Anjeon Industry supplied about half of Hyundai and Kia’s engine valves from one site; the scorecard should have shown that exposure before the March 2026 fire.
What tools help evaluate supplier performance?
A spreadsheet with a locked rubric is enough to evaluate supplier performance for fewer than 50 suppliers. Beyond that, supplier performance management modules in procurement suites automate KPI collection from the ERP, host the scorecard, and track action plans. Whatever the tool, the rubric, weights, and bands must be documented outside it so the method survives a system change.
Seven Traps That Derail Supplier Evaluation Programs
The programs that fail usually fail on method rather than effort. The table lists the seven errors we correct most often when reviewing client scorecards and supplier evaluation programs, with the fix that costs least and the standard or figure that supports it.
|
Trap |
Effect on the supplier evaluation |
Fix |
|
Operational metrics only |
Financial, concentration, and compliance risk never reach the score; Gartner’s 22% |
Add risk and compliance as a weighted criterion |
|
No written rubric |
Two evaluators differ by a point on the same data |
Publish a 1 to 5 rubric per criterion with numeric thresholds |
|
Weights changed after scoring |
Results are argued rather than accepted |
Fix weights at contract start; change only at renewal |
|
Same cadence for every supplier |
Strategic suppliers under-reviewed, transactional ones over-reviewed |
Segment first; quarterly, semi-annual, annual |
|
Scores with no action plan |
Poor performers stay poor; Ivalua’s skipped third phase |
Owner, target, date, and evidence for every sub-band score |
|
Sole source scored like any other |
Concentration invisible until the site fails, as at Anjeon |
Business continuity review and concentration KPI |
|
Buyer-caused misses blamed on the supplier |
Forecast error and late payment inflate delivery failures |
Two-way scorecard with buyer measures |
Where Supplier Evaluation Is Heading After 2026
Scorecard automation is already under way. Hackett reports 76 percent of organizations already see AI-driven improvements of 25 percent or more in key procurement metrics, and supplier scorecard population from ERP and external risk feeds is one of the first tasks being automated. Expect the manual quarterly supplier scorecard to be replaced by a continuously updated one within two years.
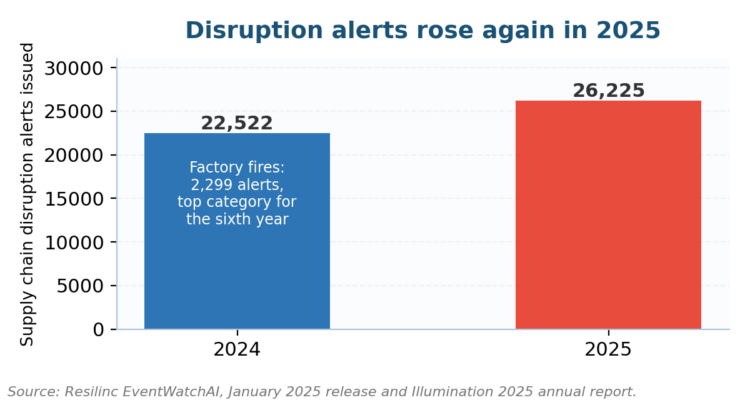
Figure 3. Resilinc’s alert count rose again in 2025; each alert is a reason to re-evaluate a supplier ahead of schedule.
By 2027, expect auditors to test the risk criterion harder than the delivery criterion. Sanctions enforcement, forced-labor import rules, and sustainability reporting all require evidence about suppliers that an operational supplier scorecard does not hold, and the ISO 28000 supply chain guide and the NIST C-SCRM guide set out the control expectations that auditors will test.
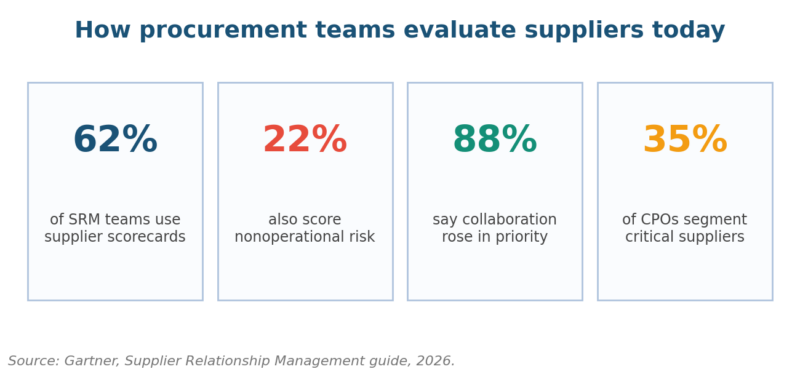
Figure 4. Gartner’s SRM data: most teams have a supplier scorecard, few score risk, and most say collaboration has become a priority.
Collaboration changes who reads the card. Gartner reports supplier collaboration rose in priority for 88 percent of procurement leaders in the past 24 months, and a shared supplier scorecard with two-way measures is the practical form that takes. The quality risk management guide and the NIST vendor questionnaire supply the templates most clients start from.
Organizations that want their supplier evaluation method designed, their scorecard rubric written, or their existing program tested against ISO 9001 clause 8.4 can send us the current supplier scorecard and the supplier list. We return the weighted model, the rubric, the segmentation, and the review calendar, with the supplier performance risk controls mapped to each criterion.
Details of the engagement options are on the services page, and a short note through the contact page gets a scoped reply within five working days. Hyundai said it would find alternative valve suppliers after the fire; the cheaper time to evaluate supplier performance is before it.

Chris Ekai is a Risk Management expert with over 10 years of experience in the field. He has a Master’s(MSc) degree in Risk Management from University of Portsmouth and is a CPA and Finance professional. He currently works as a Content Manager at Risk Publishing, writing about Enterprise Risk Management, Business Continuity Management and Project Management.