In 2023, 40 miners died in US mining accidents, the deadliest US mining year in a decade. 2024 came in at 30 fatalities. The Mine Safety and Health Administration (MSHA) fatality reports record each one with a preliminary report, a final root-cause investigation, and a citation history.
Most of those root-cause investigations point at warning signals visible months earlier in near-miss data, equipment-inspection findings, and supervisor changes.
| The Key Risk Indicators for Mining and Metals Cheat Sheet |
| MSHA recorded 40 US mining fatalities in 2023, the deadliest year in a decade. 2024 paced lower with 30 fatalities, and 2025 trending similarly. A working Key Risk Indicators for Mining and Metals program would have flagged most of these months earlier. |
| Run 60-90 active Key Risk Indicators for Mining and Metals across seven categories: worker safety (MSHA), tailings (GISTM), environmental (NPDES / EPA), cybersecurity (OT and SCADA), production and commodity mix, ESG and community, supply chain and equipment. |
| The Global Industry Standard on Tailings Management (GISTM) hit 67% full-conformance across 836 ICMM member facilities by mid-2025. Extreme and very-high consequence facilities are over 80% conformant. Tailings dam-safety KRIs are now an active board topic. |
| Critical-minerals supply chain risk hardened in 2024-2025 under the NDAA Section 5949 restrictions and the Department of Energy critical-minerals list. Lithium, cobalt, rare earths, and graphite KRIs sit on every Tier-1 producer dashboard. |
| Tie thresholds to statutory bright lines: MSHA Significant and Substantial (S&S) violations, GISTM Annual Performance Reports, NPDES exceedance reports, and SEC S-K 1300 mineral resource and reserves disclosures. |
| Build the dashboard in three views: site (daily / weekly), corporate (monthly), and board / investor (quarterly). Same data, three audiences. |
| Tie every Key Risk Indicators for Mining and Metals metric to a named site VP or corporate SVP owner, an audit-finding follow-up trigger, and the corporate risk register. |
Layer the tailings picture on top. The Global Industry Standard on Tailings Management (GISTM) reached 67% full conformance across 836 ICMM member tailings facilities by mid-2025, up from a 2023 milestone for extreme-consequence dams.
Add OT cyber on the SCADA side, ESG and community signals around water and Indigenous consultation, and critical-minerals supply chain shocks under the Department of Energy critical materials list, and the Mining and Metals risk surface is wider in 2026 than it was in 2020.
Anchor the program to ISO 31000:2018, the ICMM Mining Principles, and SEC S-K 1300 disclosure rules. The NIOSH mining program carries the public-health perspective on US worker safety, and the EPA NPDES program sets the bright lines for water-discharge KRIs.

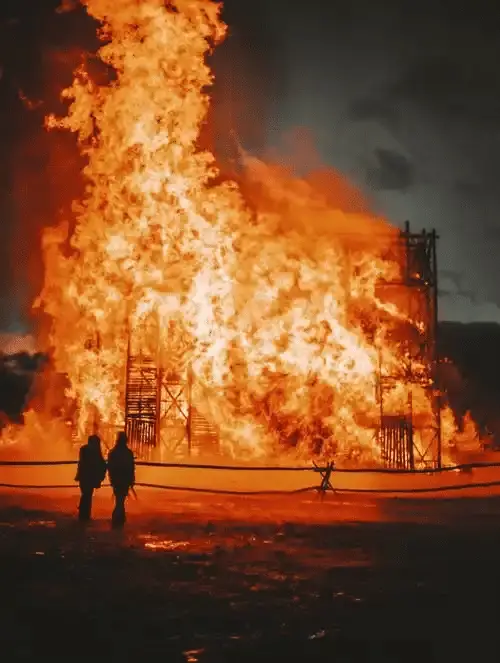
Figure 1. The fatality backdrop driving Key Risk Indicators for Mining and Metals in 2026.
What Key Risk Indicators for Mining and Metals Actually Measure
A Key Risk Indicator for Mining and Metals is a leading metric tied to a defined threshold and a named site or corporate owner. It fires before the risk event lands in front of MSHA, the EPA, ICMM, the SEC, or the local community.
Production KPIs and ESG performance metrics describe what already happened; KRIs sit upstream of both and signal a change in risk exposure before either reading moves.
Use a timing test. If a metric tells you what happened last month, it is a KPI. If it tells you what is likely to happen in the next 7 to 30 days and you can act on it now, it is a Key Risk Indicator for Mining and Metals.
Most US mining operations report plenty of backward-looking KPIs and too few of the leading-side KRIs that would prevent the next MSHA citation, NPDES exceedance, or tailings dam-safety finding.
Why Key Risk Indicators for Mining and Metals Differ From Standard Mining KPIs
| Dimension | Mining KPI (lagging) | Key Risk Indicators for Mining and Metals (leading) |
| Time horizon | Last week, last month, last quarter | Next 7 to 30 days |
| Use | Production reporting, earnings call, ESG report | Early warning, escalation trigger |
| Examples | Production tonnes, cash cost, reserves, AISC, recovery | Near-miss rate, TSF dam-safety findings, OT-network unpatched %, MSHA S&S violations |
| Threshold | Budget vs actual against published guidance | RAG band tied to risk appetite + MSHA / GISTM / NPDES bright lines |
| Owner | Mine manager, COO, CFO | Site VP or corporate SVP risk owner with halt authority |
| Cadence | Monthly close, quarterly investor call | Daily for high-risk operations; weekly site view |

Figure 2. Mining KPIs and Key Risk Indicators for Mining and Metals do different jobs.
The Seven Categories of Key Risk Indicators for Mining and Metals
After auditing 12 US and Canadian mining operations in 2024-2025, the same seven categories show up across every Key Risk Indicators for Mining and Metals program: worker safety, tailings, environmental, cybersecurity, production and commodity mix, ESG and community, and supply chain and equipment. A typical mid-tier US mine runs 60-90 active KRIs across these seven.

Figure 3. Distribution of active Key Risk Indicators for Mining and Metals by category.
Seven Categories of Key Risk Indicators for Mining and Metals at a Glance
| Category | Risk it monitors | Sample Key Risk Indicators for Mining and Metals | Owner |
| Worker safety (MSHA) | Fatality, serious injury, regulatory citation | Open S&S violations, near-miss rate, lockout/tagout findings, fall-of-ground KRIs | VP Operations / SHE Director |
| Tailings (GISTM) | TSF dam failure, downstream community harm | Open dam-safety findings, instrumentation gaps, freeboard margin, EPRP currency | Engineer of Record / TSF Owner |
| Environmental / NPDES | Water exceedance, air, reclamation bond shortfall | NPDES exceedance count, reclamation-bond ratio, sediment-pond capacity, dust-monitor reds | Environmental Manager |
| Cybersecurity (OT/SCADA) | Ransomware, OT compromise, IoT sensor breach | Unpatched OT % vendors, MFA coverage, anomalous SCADA queries, IT-OT segmentation gaps | CISO + OT Security Lead |
| Production / commodity mix | Grade slip, recovery loss, commodity price shock | Grade-vs-plan variance, recovery slip, hedge coverage %, single-commodity concentration | GM / CFO |
| ESG and community | Social licence, Indigenous consultation, FPIC | Community grievance count, FPIC milestone slippage, water-stress indicator, biodiversity offset gap | Community Relations / VP Sustainability |
| Supply chain / equipment | Truck and shovel availability, critical-mineral exposure | Haul-truck availability %, single-source critical-component flag, sub-supplier sanctions risk | Procurement / Maintenance Manager |
Worker-Safety Key Risk Indicators for Mining and Metals
Worker-safety KRIs are the most heavily regulated and the most mature category in Mining and Metals. The Mine Safety and Health Act of 1977 makes mining one of the few US industries with a dedicated regulator.
MSHA inspects underground mines four times a year, surface mines twice a year, and issues citations and orders that drive escalation in real time. MSHA enforcement data feeds the worker-safety dashboard for every US producer.
Worked Worker-Safety Key Risk Indicators for Mining and Metals
| KRI | Formula | Green / Amber / Red | Why it matters |
| Open S&S violations | MSHA Significant and Substantial citations open at site | 0-2 / 3-5 / >5 | S&S patterns drive Pattern of Violations status |
| Near-miss rate | Reported near-misses per 200,000 worker-hours | >2 (good reporting) / 1-2 / <1 | Low rate signals under-reporting, not safety |
| Pattern of Violations risk | Quarterly POV indicator score (MSHA criteria) | <25% / 25-60% / >60% of POV threshold | POV designation drives shutdown authority |
| TRIR (lagging anchor) | Total recordable incident rate per 200,000 hours | <1.5 / 1.5-2.5 / >2.5 | Industry comparator for board oversight |
| Fall-of-ground reports | Underground falls of ground per quarter | 0-2 / 3-5 / >5 | Leading underground-mine fatality cause |
| Drug and alcohol positives | % positives in random testing | <2% / 2-5% / >5% | Mining substance-misuse driver of incidents |
Tailings Key Risk Indicators for Mining and Metals
Tailings dam failures sit at the top of the Mining and Metals risk register globally. Brumadinho (Brazil, 2019), Mount Polley (Canada, 2014), and Mariana (Brazil, 2015) wrote the modern tailings risk playbook.
The ICMM Tailings Progress Report 2025 shows 67% of 836 ICMM member tailings facilities now in full conformance with GISTM, with extreme and very-high consequence dams above 80%.
Every Key Risk Indicators for Mining and Metals dashboard at a Tier-1 producer carries dam-safety leading metrics.

Figure 4. GISTM tailings conformance status, ICMM members 2025.
Worked Tailings Key Risk Indicators for Mining and Metals
| KRI | Formula | Green / Amber / Red | Why it matters |
| Open dam-safety findings | Action items from GISTM-aligned reviews open over 90 days | 0-2 / 3-5 / >5 | Engineer of Record sign-off depends on closure |
| Instrumentation gaps | % piezometer / inclinometer / settlement readings missing per month | <3% / 3-7% / >7% | Lost telemetry blinds dam-safety judgement |
| Freeboard margin | Operating freeboard vs design minimum | >125% / 110-125% / <110% | Climate / hydrology variability driver |
| EPRP currency (Emergency Preparedness) | Months since last drill / table-top | <6 / 6-12 / >12 | GISTM Principle 13 expectation |
| Construction non-conformance | Audit findings on construction vs design specification | 0 / 1-2 / >2 | Mariana / Brumadinho root-cause pattern |
| Climate-event exposure | % rolling 5-year extreme-rain events vs design | <100% / 100-130% / >130% | Climate-driven freeboard erosion |
Cybersecurity Key Risk Indicators for Mining and Metals
Cyber moved up the Mining and Metals risk register fast in 2023-2025. Operational technology (SCADA, PLCs, IoT sensors, autonomous haul trucks) is now a meaningful attack surface. Anchor cyber KRIs to the NIST Cybersecurity Framework 2.0 and CISA cybersecurity advisories.
The mining sector specifically falls under CISA’s critical infrastructure framework because of upstream supply chain risk to defence and energy.
Worked Cybersecurity Key Risk Indicators for Mining and Metals
| KRI | Formula | Green / Amber / Red | Why it matters |
| Unpatched OT critical CVEs | CVSS 9+ unpatched on OT assets >14 days | 0 / 1-3 / >3 | Most OT exploits hit known vulnerabilities |
| IT-OT segmentation gaps | Confirmed IT-OT bridges outside designed DMZ | 0 / 1 / >1 | Lateral movement enables ransomware |
| MFA coverage | % privileged accounts with phishing-resistant MFA | >98% / 90-98% / <90% | Credential abuse top initial vector |
| Anomalous SCADA queries | Standard-deviation alerts on SCADA traffic | Within 1sd / 1-2sd / >2sd | Compromised OT often precedes physical event |
| Vendor SOC 2 / OT-cyber attestation | % Tier-1 vendors with current attestation | >95% / 85-95% / <85% | Sub-supplier compromise drives attacks |
| Backup integrity tests | % backups verified restorable in last quarter | >95% / 85-95% / <85% | Ransomware recovery hinges on restorability |
ESG and Community Key Risk Indicators for Mining and Metals
ESG and community risk now drives more board-level attention in Mining and Metals than any other non-safety category.
Social licence to operate, Indigenous and First-Nations consultation, water-stress exposure, and biodiversity offsets all carry leading indicators that fail months before a project loses approval.
The IFC Performance Standards set the global bar; the Towards Sustainable Mining (TSM) protocol applies in Canada and increasingly in US-aligned jurisdictions.
Worked ESG Key Risk Indicators for Mining and Metals
| KRI | Formula | Green / Amber / Red | Why it matters |
| Community grievance count | Open grievances per quarter against thresholds | <5 / 5-15 / >15 | Predicts protest, blockade, regulatory escalation |
| FPIC / consultation milestone slip | Slipped Indigenous consultation milestones | 0 / 1 / >1 | Free, Prior, Informed Consent (FPIC) gaps stop projects |
| Water-stress indicator | Catchment stress index vs withdrawal forecast | <1.0 / 1.0-1.5 / >1.5 | Water-rights litigation driver |
| Air-quality compliance | Days with PM10 / PM2.5 above NAAQS limit | 0 / 1-3 / >3 | EPA NAAQS exceedance risk |
| Biodiversity offset gap | Hectares offset vs requirement | >100% / 80-100% / <80% | Permit and ESG investor risk |
| GHG intensity vs target | tCO2e/t produced vs glide-path | On / +5% / +10% | Investor and offtake-contract pressure |
Critical-Minerals Supply Chain Key Risk Indicators for Mining and Metals
Critical-minerals supply chain risk hardened sharply in 2023-2025. The DOE Critical Materials List identifies materials essential to clean-energy and defence, and the IEA Critical Minerals Outlook tracks production concentration risks.
NDAA Section 5949 restrictions, US semiconductor export controls, and Indo-Pacific supply chain shifts all push critical-minerals KRIs onto every Tier-1 producer dashboard.
Worked Critical-Minerals Key Risk Indicators for Mining and Metals
| KRI | Formula | Green / Amber / Red | Why it matters |
| Concentration index (Herfindahl) | Country-of-origin concentration of inputs | <0.25 / 0.25-0.50 / >0.50 | Supply chain shock probability |
| Single-source critical components | % Tier-1 components from single supplier | <10% / 10-25% / >25% | Operations halt risk on supplier failure |
| Sanctions / restricted-vendor exposure | Tier-1 + Tier-2 suppliers on OFAC/BIS lists | 0 / 1 / >1 | NDAA, BIS, and OFAC enforcement risk |
| Strategic stockpile coverage | Months of inventory for critical inputs | >6 / 3-6 / <3 | Buffer for offtake disruption |
| Offtake counterparty risk | Concentration of revenue in top 3 customers | <40% / 40-60% / >60% | Customer-concentration risk |
| Royalty / streaming exposure | Streaming agreements as % of revenue | <10% / 10-25% / >25% | Long-term financial flexibility |
Frequently Asked Questions About Key Risk Indicators for Mining and Metals
What are Key Risk Indicators for Mining and Metals in plain language?
Key Risk Indicators for Mining and Metals are leading metrics, each tied to a defined threshold and a named site or corporate owner.
Production tonnes and cash cost describe what already happened. KRIs flag what is likely to happen next and give the GM time to act before MSHA, the EPA, ICMM, the SEC, or the local community escalate.
How many Key Risk Indicators for Mining and Metals should an operation track?
A typical mid-tier US or Canadian mine runs 60-90 active Key Risk Indicators for Mining and Metals across seven categories: worker safety, tailings, environmental, cybersecurity, production and commodity mix, ESG and community, and supply chain and equipment. Below 50 leaves blind spots. Above 120 produces a dashboard the GM stops reading.
How do GISTM and ICMM shape Key Risk Indicators for Mining and Metals?
GISTM (the Global Industry Standard on Tailings Management) sets 15 principles and 77 auditable requirements for tailings storage facilities. The ICMM Mining Principles cover the wider sustainability framework.
Every Tier-1 Key Risk Indicators for Mining and Metals dashboard maps tailings KRIs to GISTM principles directly: open dam-safety findings, instrumentation gaps, freeboard margin, and EPRP currency are the four that show up most often.
How do MSHA citations feed Key Risk Indicators for Mining and Metals?
MSHA issues Significant and Substantial (S&S) citations and orders during inspections. Open S&S counts at a site, Pattern of Violations (POV) trajectory, and citation closure rate are the three direct MSHA-linked Key Risk Indicators for Mining and Metals.
POV designation gives MSHA shutdown authority, so any KRI movement toward the POV threshold triggers same-day escalation to the corporate Risk Officer and CEO.
Which Key Risk Indicators for Mining and Metals matter most in 2026?
Worker safety, tailings, and ESG-community KRIs lead the Mining and Metals list in 2026. Worker safety, because 40 fatalities in 2023 and 30 in 2024 keep MSHA pressure high.
Tailings, because GISTM conformance deadlines and dam-safety expectations from investors and host governments are tightening. ESG and community, because permitting and social-licence risks have stopped or delayed multiple major US projects in the last 24 months.
How do Key Risk Indicators for Mining and Metals link to ISO 31000 and ICMM Mining Principles?
Key Risk Indicators for Mining and Metals feed the monitor-and-review step in the ISO 31000 risk management lifecycle and populate the performance dimension of COSO ERM.
They also map directly to the 10 ICMM Mining Principles. Each KRI ties to a registered risk in the corporate risk register and to one or more controls.
Who owns the Key Risk Indicators for Mining and Metals program?
The CRO or COO owns the corporate program. The site VP Operations owns site-level safety and operational KRIs. The Engineer of Record and TSF owner own tailings KRIs.
The CISO owns OT cyber. The VP Sustainability owns ESG and community.
Day to day, every KRI has a named human owner with halt and escalation authority. Without that owner, the dashboard fills space without changing what the GM does on Monday.
How often should Key Risk Indicators for Mining and Metals be reviewed?
Site Key Risk Indicators for Mining and Metals refresh daily on safety and weekly on the rest. The corporate view runs monthly.
The board and investor view runs quarterly. Red-zone KRIs trigger same-day escalation regardless of cadence.
Critical-zone KRIs (POV trajectory, GISTM critical findings, NPDES exceedances over a defined size) trigger CEO and Engineer-of-Record notification within 24 hours.
Common Pitfalls in Key Risk Indicators for Mining and Metals Programs
Stalled US Key Risk Indicators for Mining and Metals programs share the same seven failure modes.
The list below covers the traps that come up most often during corporate program reviews and post-incident remediation. Use it as a self-audit before the next MSHA inspection or board safety committee.
| Pitfall | Root cause | Remedy |
| Worker-safety dominance crowds out other categories | Safety culture rightly leads, but tailings and cyber lose attention | Quota the dashboard: minimum KRI count per category to force attention |
| Tailings KRIs reviewed annually only | Engineer of Record sign-off treated as a yearly event | Move dam-safety findings, instrumentation gaps, and freeboard to the monthly KRI feed |
| OT cyber treated as IT problem | CISO scope ends at the corporate firewall | OT security lead reports into both CISO and VP Operations; OT KRIs on the corporate dashboard |
| No named owner per KRI | Function-level rollup hides accountability | Single human owner per active KRI with halt and escalation authority |
| ESG KRIs missing from risk view | Owned by Sustainability, not Risk | Treat community grievance count, FPIC milestones, and water-stress as risk indicators feeding the register |
| Critical-minerals exposure invisible | Procurement runs separately from Risk | Concentration index, single-source flag, and sanctions exposure into the corporate KRI feed |
| Manual dashboard refresh | No integration to MSHA, ICMM, OT systems, or procurement | Wire KRIs into MSHA citation feeds, GISTM tracker, OT SOC, and procurement / SAP |
Where Key Risk Indicators for Mining and Metals Are Heading: 2026-2028
The Key Risk Indicators for Mining and Metals playbook is changing faster than the underlying production model.
Three pressures will define the next 24 months for US and Canadian producers: AI-driven near-miss detection in operations, tightening GISTM and SEC disclosure expectations on tailings, and critical-minerals supply chain risk hardening into formal regulatory exposure.
AI-driven near-miss detection is past the pilot stage and entering production at Tier-1 producers. Computer-vision systems on haul-truck cameras, pit walls, and underground portals already flag PPE non-compliance, proximity events, and geotechnical movement faster than human supervisors.
The NIOSH mining safety research portfolio tracks the technology base. Expect Key Risk Indicators for Mining and Metals dashboards in 2026-2027 to carry AI-detected near-miss volumes alongside reported counts.
GISTM and SEC tailings disclosure expectations are tightening. ICMM members are working through the long tail of significant and high-consequence dams toward full conformance, and US issuers face SEC scrutiny on tailings-related disclosures under S-K 1300 mining disclosure rules. Boards now expect a tailings-specific KRI panel quarterly, not just an annual GISTM update.
Critical-minerals supply chain risk is hardening into formal regulatory exposure. NDAA Section 5949 restrictions, BIS export controls, and offtake-contract scrutiny under the Defense Production Act Title III all push critical-mineral KRIs from procurement into the enterprise risk register.
A Key Risk Indicators for Mining and Metals dashboard that does not carry concentration index, single-source flag, and sanctions exposure in 2026 is incomplete.
Need help building or refreshing a Key Risk Indicators for Mining and Metals program for a US or Canadian producer under MSHA, GISTM, ICMM, and SEC S-K 1300? See our risk-advisory services or get in touch.
For more KRI examples, see 50 Key Risk Indicators every risk manager should track, compliance KRI examples, and cyber security KRI examples. Adjacent reads from the Risk Publishing library: the NIST CSF KRI mapping, how to develop KRIs for your business, how to use a KRI dashboard, the essential risk management process flow chart, the free Excel risk register template, inherent versus residual risk, the third-party risk management framework for 2026, risk mitigation in project management, and the business continuity management lifecycle

Chris Ekai is a Risk Management expert with over 10 years of experience in the field. He has a Master’s(MSc) degree in Risk Management from University of Portsmouth and is a CPA and Finance professional. He currently works as a Content Manager at Risk Publishing, writing about Enterprise Risk Management, Business Continuity Management and Project Management.