| Key Risk Indicators for Human Resources: Key Takeaways |
|---|
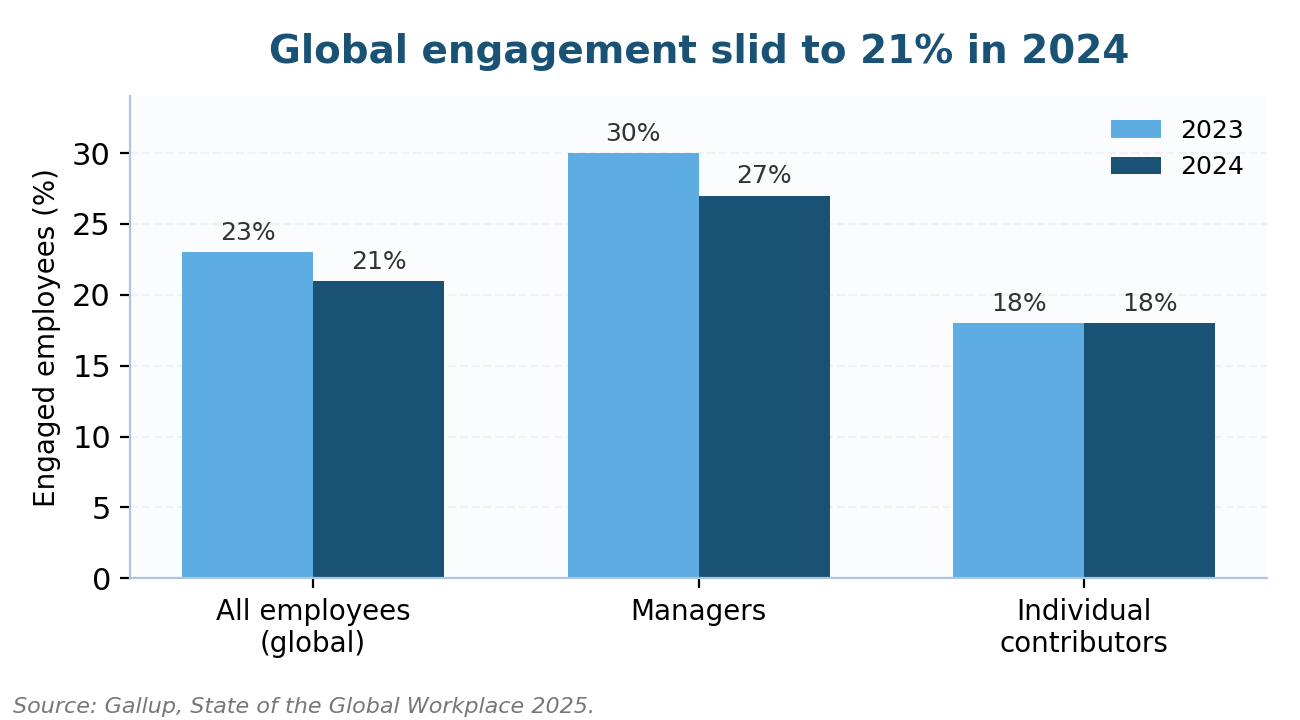
| Global employee engagement fell to 21% in 2024, and Gallup prices that slide at $438 billion in lost productivity worldwide. |
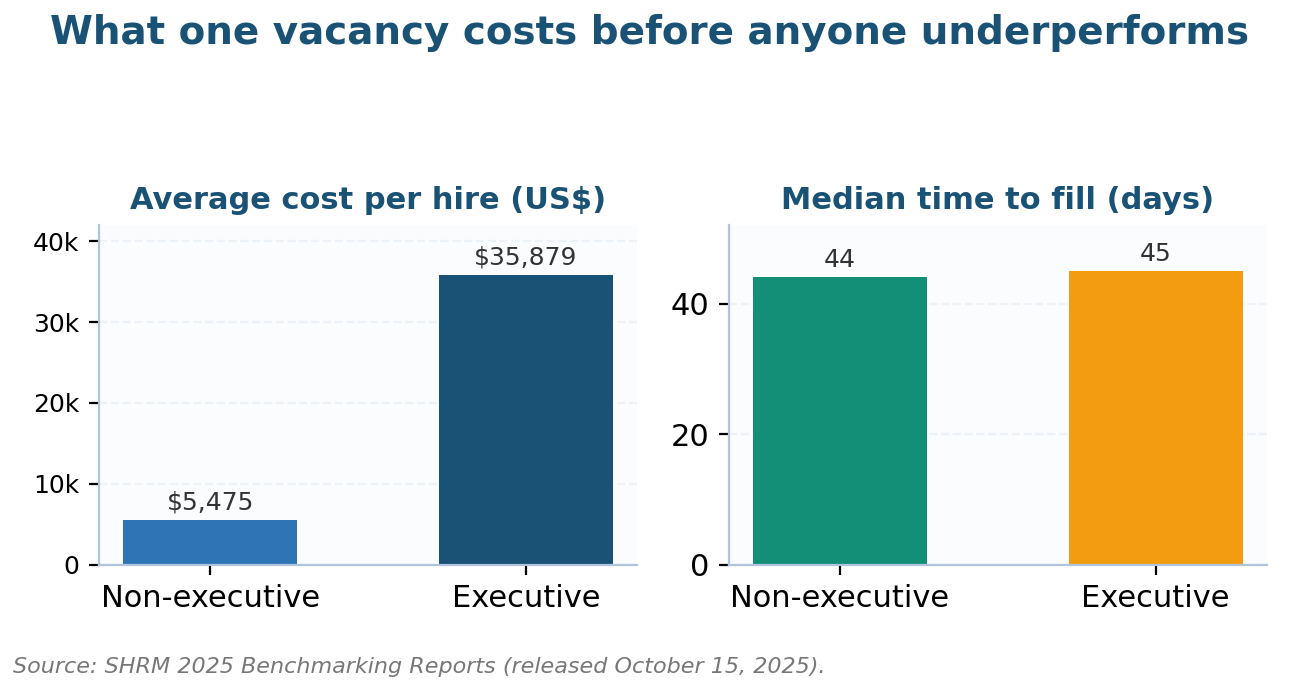
| SHRM’s 2025 benchmarks put average cost per hire at $5,475, and $35,879 for executives, so hiring KRIs guard real money. |
| The BLS counted 3.2 million quits in June 2026 alone; regretted turnover above 8% annualized deserves an amber flag. |
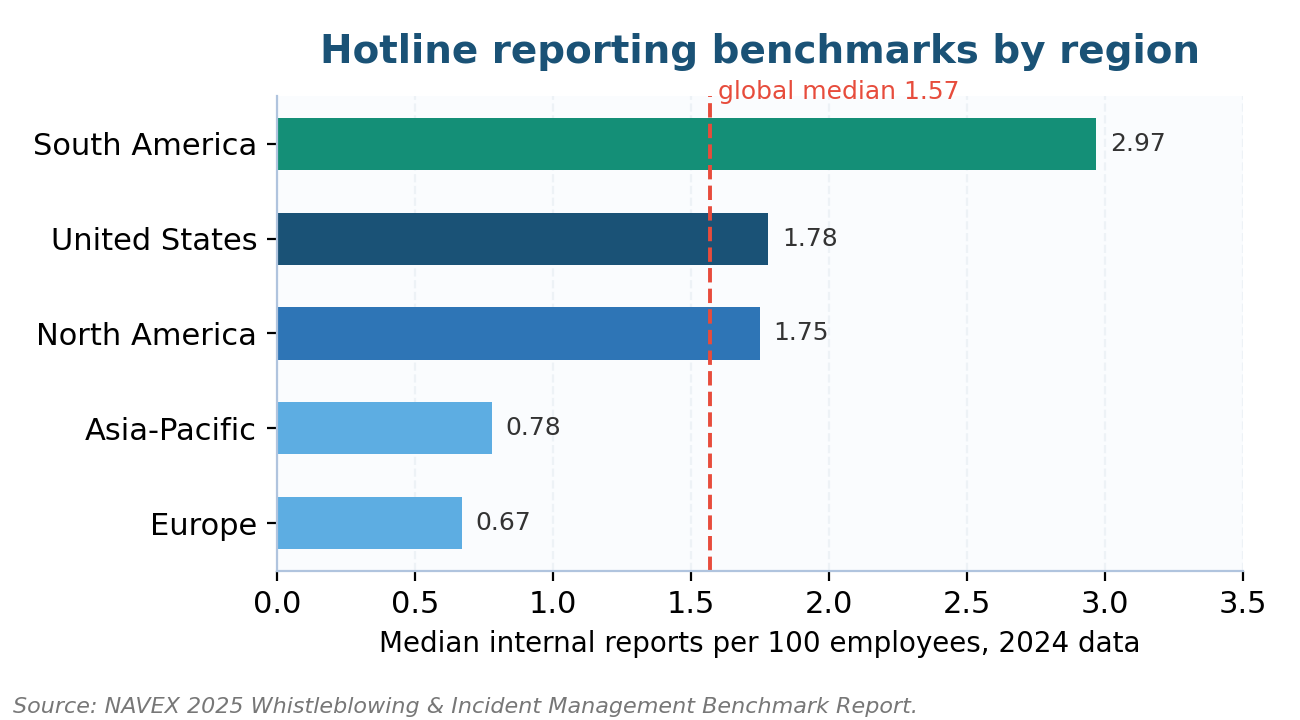
| NAVEX’s 2025 median of 1.57 hotline reports per 100 employees gives conduct KRIs a defensible baseline, and silence is itself a warning. |
| The EEOC recovered a record $660 million in FY2025, which makes complaint-aging and training-completion KRIs cheap insurance. |
| The World Economic Forum expects 39% of core skills to change by 2030; a reskilling-coverage KRI keeps that gap visible to the board. |
Key risk indicators for human resources are measurable early warnings that HR teams track against preset thresholds. They cover regretted turnover, absence rate, time to fill, and hotline report volume. Each indicator pairs one metric with a limit, an owner, and an escalation path, so people risk surfaces months before it lands as financial loss.
On July 23, 2025, Columbia University agreed to fund a $21 million claims pool to settle EEOC findings of workplace antisemitism. It ranks among the agency’s largest public settlements in nearly two decades. No metric inside the university flagged the complaint pattern early enough to cap that exposure.
The fund sat inside a broader $200 million federal agreement, and the EEOC opened the claims window in December 2025, per HR Dive’s reporting. Losses that size rarely arrive unannounced. They start as small drifting numbers: complaint counts, turnover spikes in one department, training gaps nobody escalates.
This guide rebuilds the HR KRI toolkit with 2026 benchmarks from Gallup, SHRM, the BLS, NAVEX, and the World Economic Forum. You get worked thresholds for turnover, absence, hiring, conduct, and skills indicators, plus the escalation rules that make each one part of a working risk register.

What Key Risk Indicators for Human Resources Measure
Columbia’s bill makes the definition concrete. A key risk indicator is a forward-looking measurement that flags rising exposure early, the monitoring role ISO 31000 builds into the risk management process. Applied to people risk, KRIs watch workforce behavior for the drift that precedes losses.
Confusion with performance metrics kills more dashboards than bad data does. A KPI reports how well hiring or retention performed last quarter, while a KRI warns how likely tomorrow’s loss has become, a distinction AIHR’s practitioner guidance draws sharply. Most HR functions track dozens of employee KPIs and almost no true KRIs.
| Dimension | HR KPI | HR KRI |
|---|---|---|
| Question answered | How did we perform? | How exposed are we? |
| Orientation | Backward; reports results | Forward; signals rising risk |
| Example | Offer acceptance rate hit 92% | Acceptance falling three straight quarters |
| Response to a miss | Coach the team, adjust targets | Escalate to the named risk owner |
Standards now back this up. ISO 30414, refreshed in 2025, defines human capital reporting across 11 areas, including turnover, compliance and ethics, and workforce availability, which reads like a ready-made KRI catalog. Boards that adopt it inherit defensible definitions instead of arguing about what counts as regretted attrition.
Why People Risk Now Sits on the Corporate Risk Register
Definitions only matter because the exposure has grown. Mercer’s People Risk 2026 study polled 4,517 HR and risk professionals across 26 markets, and AI disruption, cyber threats, and geopolitical uncertainty topped the list. Every one of those risks moves through the workforce first.
Engagement data shows the slide in progress. Gallup’s State of the Global Workplace 2025 report found engagement fell from 23 percent to 21 percent in 2024, costing an estimated $438 billion in lost productivity worldwide. Manager engagement dropped from 30 to 27 percent, and managers explain 70 percent of team-level variance.
Regulators are collecting on the same neglect. The EEOC recovered a record $660 million for 17,680 workers in fiscal year 2025, with pre-litigation recoveries up 12 percent on the prior year. An enterprise risk management framework that leaves people risk unquantified is blind on the fastest-moving exposure it owns.
| Domain | Signature KRI | 2026 benchmark | Source |
|---|---|---|---|
| Retention | Regretted turnover rate | 2.0% monthly quits rate, economy-wide | BLS JOLTS, June 2026 |
| Absence | Unplanned absence rate | 3.2% of full-time workers | BLS CPS, 2025 |
| Hiring | Time to fill | 44 days median, non-executive | SHRM 2025 |
| Conduct | Hotline reports per 100 staff | 1.57 global median | NAVEX 2025 |
| Skills | Core-skill change exposure | 39% of skills by 2030 | WEF 2025 |
Turnover and Retention Signals That Fire Early
Churn remains the loudest people signal. The Bureau of Labor Statistics counted 3.2 million quits in June 2026, a 2.0 percent monthly rate, with total separations at 3.4 percent. Those economy-wide averages give a turnover KRI its outer calibration, and your own trend line supplies the alarm.
Raw turnover misleads, though. A 15 percent exit rate among bottom performers can be healthy, while 8 percent regretted attrition in a critical engineering team is an emergency. Segment the indicator by performance tier, tenure band, and business unit, the way our key risk indicators examples catalog structures them.
| Turnover KRI | Formula | Amber | Red |
|---|---|---|---|
| Regretted turnover rate | Regretted exits / average headcount | >8% annualized | >12% annualized |
| First-year attrition | Exits under 12 months / hires | >15% | >25% |
| Critical-role vacancy exposure | Vacant critical roles / total critical roles | >5% | >10% |
| Manager span instability | Teams changing manager twice in 12 months | >10% of teams | >20% of teams |
Exit waves telegraph themselves months out, so pair the lagging rate with leading signals. Gallup’s finding that only 44 percent of managers ever receive formal training explains why team-level warnings surface first. Watch these five feeders before the quarterly number moves:
- Internal-mobility applications from one team doubling quarter over quarter
- Engagement or eNPS scores falling for two consecutive surveys in the same unit
- Overtime and weekend log-ins climbing while output stays flat
- One-on-one meetings skipped for six weeks or more by the same manager
- Benefits and pension queries spiking ahead of vesting dates
Absence, Wellbeing, and the Quiet Cost Curve
Attrition at least announces itself with a resignation letter, while absence erodes quietly. The BLS absence survey puts the full-time unplanned absence rate at 3.2 percent, roughly 2.2 points from illness or injury and one point from other personal reasons. Your KRI should track the trend, not the level.
The money involved justifies board attention. CDC-published research prices illness-related productivity loss at $225.8 billion a year for US employers, about $1,685 per employee. Concentration matters more than totals: an absence heat map by site and shift exposes the two locations usually carrying half the problem.
| Absence KRI | What it catches | Amber threshold | Escalation owner |
|---|---|---|---|
| Rolling 12-month absence rate | Chronic under-resourcing | >1.5x industry baseline | HR business partner |
| Bradford factor per employee | Frequent short absences | Score above 250 | Line manager review |
| Absence concentration | Site or shift hotspots | One unit >2x company mean | Site leadership |
| Absence-to-overtime ratio | Burnout loops forming | Both rising two quarters | CHRO dashboard |
Hiring Pipeline Indicators Worth a Dashboard Tile
Vacancy risk compounds while a role sits open. SHRM’s 2025 Benchmarking Reports put average cost per hire at $5,475 for non-executive roles and $35,879 for executives, with median time to fill at 44 and 45 days respectively. Every added week extends the exposure.
Time to fill is the classic early indicator here, and its slope matters more than its value. A recruiting function drifting from 40 to 55 days across two quarters is losing either employer attractiveness or process discipline. Offer acceptance and 90-day attrition tell you which one it is.
| Hiring KRI | Formula | Watch level | Why it predicts loss |
|---|---|---|---|
| Time to fill, critical roles | Days from approval to acceptance | >60 days | Vacancy cost outruns salary saved |
| Offer acceptance rate | Offers accepted / offers made | <85% | Pay or brand slipping against market |
| 90-day new-hire attrition | Exits within 90 days / starts | >8% | Selection or onboarding failure |
| Cost per hire vs benchmark | Loaded spend / hires | >1.5x SHRM $5,475 | Sourcing model breaking down |
Track these beside the operational measures on your risk management KPI dashboard, inside the same monthly pack finance reads. Hiring indicators only change behavior when line leadership sees them next to revenue and operational risk metrics, on the same review cycle, with the same expectation of explanation.
Conduct, Compliance, and the Hotline Baseline
Columbia’s $21 million fund traces to a conduct-monitoring failure. Conduct exposure builds through channels HR already owns: complaint intake, investigation queues, and mandatory training completion. The EEOC’s record fiscal 2025 haul shows the price of missed warnings, and $528 million of it came from ordinary pre-litigation workplace complaints.
Benchmark the intake channel before judging its numbers. NAVEX’s 2025 benchmark, drawn from 2.15 million reports across organizations employing 69 million people, sets the global median at 1.57 reports per 100 employees, with US organizations at 1.78. A low rate usually signals fear of reporting, never the absence of problems.
Fold these indicators into your compliance risk assessment so thresholds carry consequences. A structured program for managing compliance risks should log three reportable events. Those are a silent hotline in one region, an investigation backlog past 45 days, and training completion under 95 percent, each with a named owner.
| Conduct KRI | Healthy range | Reportable breach | Reference point |
|---|---|---|---|
| Hotline reports per 100 employees | 0.8 to 2.0 | Below 0.3, or a sudden 2x spike | NAVEX 2025 median 1.57 |
| Investigation aging | 90% closed inside 45 days | Any case past 90 days | EEOC charge exposure |
| Harassment-training completion | Above 95% within 30 days | Below 90% in any unit | State mandates: NY, CA, IL |
| Substantiation rate | 30% to 50% of closed cases | Sustained below 15% | Signals weak investigations |
| Repeat-subject cases | Under 5% of caseload | Same leader named twice in 12 months | Pattern liability |
Skills, Succession, and the Reskilling Clock
The forward-looking end of people risk is capability, and the gap is quantifiable. The World Economic Forum’s Future of Jobs Report 2025 expects 39 percent of core skills to change by 2030. Fifty-nine of every 100 workers will need training, and 11 of them are unlikely to receive it.
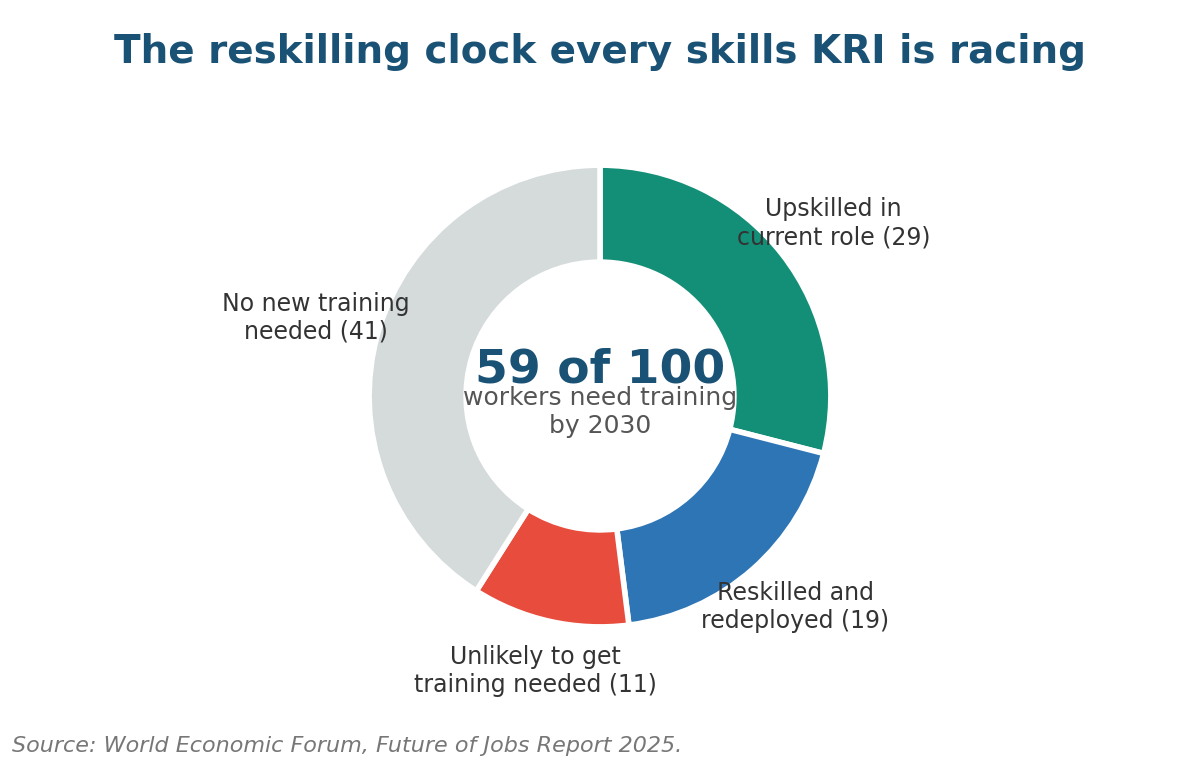
Succession thinness deserves the same treatment. Cover ratio for critical roles, bench readiness, and single-point-of-failure counts convert an org chart into a risk statement a board can act on. WEF’s projection of 170 million new roles against 92 million displaced by 2030 makes static role definitions their own hazard.
Certification currency sits on the same tile, especially in regulated functions where lapsed credentials void controls. Teams holding recognized risk management certifications also read indicator data with more discipline. A skills KRI set is board material when it flags these events inside a month:
- A critical role losing its only ready successor to resignation or transfer
- Mandatory license or certification lapses in audit, actuarial, or safety roles
- Reskilling-program completion falling below 80 percent of the cohort plan
- AI-exposed roles with no redeployment path mapped after two review cycles
How to Build HR Key Risk Indicators Step by Step
Selection discipline separates a working set from wall decor. COSO’s ERM guidance and the ISO 31000 versus COSO comparison land on the same test. An indicator must map to a named risk, a stated appetite, and a decision someone will actually take when the threshold breaks.
Start from your top five people risks and work backward to data you already hold in the HRIS, the ATS, and the case management system. Draft ten candidate indicators, then cut half using these filters, which mirror how to develop key risk indicators generally:
- Predictive: the metric moves before the loss, verified against two years of history
- Controllable: a named owner can move the number with resources they already hold
- Measurable monthly: quarterly data cannot catch a 90-day exit wave
- Threshold-ready: amber and red limits trace to the risk appetite statement
- Auditable: definition, source system, and calculation documented once, centrally
Thresholds come from the appetite statement, and the wording matters. Our risk appetite statements examples show the pattern: tie each limit to tolerance language the board approved, and log every breach with its response. Then retire stale indicators at each pass of the risk management lifecycle.
| People risk | Leading KRI | Lagging KRI | First escalation |
|---|---|---|---|
| Key-person exit | Successor cover ratio below 1.0 | Regretted turnover rate | CHRO within five days |
| Burnout wave | Absence-to-overtime ratio rising | Absence rate vs baseline | Site leader, monthly |
| Conduct event | Hotline silence or sudden spike | Substantiated case count | Ethics committee |
| Hiring failure | Offer acceptance below 85% | 90-day attrition above 8% | TA director sprint |
| Skills gap | Reskilling completion below 80% | Critical-vacancy days | Board talent review |
Frequently Asked Questions About HR Key Risk Indicators
What are key risk indicators for human resources?
Key risk indicators for human resources are threshold-based metrics that warn of rising people risk before losses occur, covering turnover, absence, hiring health, conduct, and skills coverage. Each pairs a formula with an amber and red limit, a named owner, and a defined escalation route into the corporate risk register.
How do HR key risk indicators differ from HR KPIs?
KPIs score past performance, such as last quarter’s offer acceptance rate, while HR key risk indicators read the same data forward to flag growing exposure. The practical test is the response: a KPI miss triggers coaching, while a KRI breach triggers escalation to a risk owner with authority to act.
How many HR key risk indicators should a function track?
Eight to twelve HR key risk indicators cover most organizations: two or three each for turnover, absence, hiring, conduct, and skills. Beyond fifteen, dashboards decay into reporting exercises nobody reads. Review the set twice a year and retire any indicator that has never changed a decision.
What turnover threshold should HR KRIs use?
Calibrate against the BLS quits rate, which ran at 2.0 percent monthly in June 2026, then tighten for your critical population. Common practice sets amber at 8 percent annualized regretted turnover and red at 12 percent, with any critical-role cluster of three exits in one quarter escalating immediately.
Which key risk indicators for human resources satisfy ISO 30414 reporting?
ISO 30414’s eleven reporting areas map onto a KRI set: turnover and mobility, compliance and ethics, workforce availability, skills and capabilities, and organizational health carry natural indicators. The 2025 refresh of the standard strengthens external disclosure, so metrics your board reviews may soon reach investors too.
How often should human resources KRIs go to the board?
Report monthly to the executive people-risk owner and quarterly to the board risk committee, with breach alerts moving immediately regardless of cycle. Quarterly-only reporting misses 90-day exit waves entirely. Present trend lines against thresholds, and open each pack with whatever sits in amber or red.
Where HR Risk Monitoring Breaks Down
Most failed programs die from design choices visible on day one. The five failures below surface repeatedly in reviews of stalled dashboards, together with corrections that need no new software. Check your current pack against them before adding a single new metric.
| Pitfall | Root cause | Remedy |
|---|---|---|
| Metrics without owners | Dashboard built before governance | Assign one accountable owner per indicator |
| Averages hiding hotspots | Company-wide aggregation | Segment by unit, site, tenure, and performance tier |
| Vanity precision | Tracking whatever the HRIS exports easily | Start from the top risks, work back to data |
| Annual-only review | KRIs treated as report content | Monthly executive cycle, quarterly board cycle |
| No appetite linkage | Thresholds set by intuition | Derive limits from the approved appetite statement |
The People Risk Agenda Through 2027
Two budget cycles from now, these dashboards will look different. Mercer’s 2026 people-risk rankings already show AI disruption and geopolitical volatility crowding the top. That pulls workforce-planning indicators, redeployment coverage, and location concentration metrics out of specialist reports and into the pack boards read quarterly.
Disclosure pressure comes next. ISO 30414’s 2025 revision moves human capital reporting toward investor-grade treatment, and engagement, turnover, and skills-coverage numbers will read differently once outside audiences can compare them across companies. Clean KRI definitions today spare an expensive scramble later.
The manager layer remains the cheapest control in the whole system. Gallup attributes 70 percent of engagement variance to managers, yet fewer than half receive formal training. An organization that treats manager capability as a monitored indicator, with the same seriousness as hotline volume, buys down several risks at once.
CHROs and risk officers who want this installed can start with a working session. We design HR KRI sets, thresholds, and board reporting packs against ISO 31000 and ISO 30414. Our services page lists the engagement formats; contact us and a one-page threshold matrix is usually ready inside two weeks.

Chris Ekai is a Risk Management expert with over 10 years of experience in the field. He has a Master’s(MSc) degree in Risk Management from University of Portsmouth and is a CPA and Finance professional. He currently works as a Content Manager at Risk Publishing, writing about Enterprise Risk Management, Business Continuity Management and Project Management.