An NFPA 780 lightning risk assessment is the Annex L procedure that compares a structure’s expected annual lightning strikes (Nd) with the frequency its owner can tolerate (Nc). When Nd exceeds Nc, the standard recommends a lightning protection system. The 2026 edition keeps the simplified and detailed methods and adds tighter inspection and surge guidance.
Early on Monday, August 17, 2026, lightning struck Explorer Pipeline’s Glenpool tank farm outside Tulsa, Oklahoma, and fire spread across three tanks of natural gasoline. Insurance Journal reported that the site stores about 3.4 million barrels across more than 30 tanks, and Explorer shut all movements in and out of Glenpool that afternoon.
Nearly 50 emergency personnel worked the fire with foam and cooling water until it stopped burning around 8:30 that evening. Residents and schools sheltered in place, roads closed, and the adjacent Phillips 66 facility halted operations even though it took no damage. No injuries were reported.
|
The Practitioner’s Cheat Sheet |
|
Annex L of NFPA 780 compares Nd, the expected annual strikes to a structure, with Nc, the tolerable frequency; protection is recommended when Nd exceeds Nc. |
|
Nd = Ng x Ad x Cd x 10^-6, where Ng is flash density, Ad the collection area LW + 6H(L+W) + 9(pi)H^2, and Cd the location coefficient from 0.25 to 2. |
|
Nc = 1.5 x 10^-3 divided by C2 x C3 x C4 x C5: construction, contents, occupancy, and consequence coefficients that range from 0.5 to 10. |
|
US insurers paid $1.65 billion on 61,986 lightning claims in 2025, and the average claim reached $26,616, up 146.9 percent since 2017 (Triple-I, June 2026). |
|
Vaisala counted 252 million US lightning strikes in 2025, an eight-year high; Florida led density at 305 events per square mile. |
|
The 2026 edition of NFPA 780 revises inspection intervals, surge protection, and the risk assessment annex; IEC 62305-2:2024 replaced flash density with ground strike-point density. |
That is the loss profile Annex L of NFPA 780 was written to assess: flammable contents, environmental consequences, and a site in one of the five densest lightning states in the country. The assessment below shows how the arithmetic works, where it stops, and what the 2026 edition changed.
What an NFPA 780 Lightning Risk Assessment Measures
Start with the document itself. NFPA 780, Standard for the Installation of Lightning Protection Systems, is the National Fire Protection Association’s installation standard, and Annex L supplies its risk assessment. The 2026 edition runs to roughly 100 pages and sells for $165 through the Lightning Protection Institute, which resells the NFPA copyright document at cost.
Annex L answers one question: does this structure need a lightning protection system? It does so by estimating how often lightning will strike the structure each year and comparing that figure with a tolerable frequency derived from construction, contents, occupancy, and the consequences of a strike. The Lightning Protection Institute’s tolerable-risk guidance lists the same five factors.
|
Risk component |
Loss it measures |
Structures where it usually decides the outcome |
|
R1 |
Loss of human life or injury from a direct strike, a nearby strike, or a strike to an incoming service |
Schools, hospitals, prisons, stadiums, places of worship |
|
R2 |
Loss of service to the public: power, water, telecoms, data |
Utilities, data centers, control rooms, airfield lighting |
|
R3 |
Loss of cultural heritage that cannot be replaced |
Historic buildings, museums, archives |
|
R4 |
Loss of economic value: building, contents, and business interruption |
Warehouses, tank farms, laboratories, manufacturing plants |
Those four components belong to the detailed method, which VFC Lightning’s guide describes as the annual threat of occurrence multiplied by the probability of damage and the expected loss. The simplified method folds the same ideas into coefficients so that a facility manager can complete the calculation in an afternoon.
The vocabulary matches any other assessment: a hazard, a likelihood, a consequence, and a tolerance. Readers who want the generic method first can start with what a risk assessment is and the difference between a hazard and a risk before returning to the lightning-specific arithmetic. Our broader lightning protection risk assessment post covers system design once the decision is made.
Why Lightning Losses Are Climbing Faster Than Strike Counts
The consequence coefficients in the formula stand for losses that have risen every year. The Insurance Information Institute’s June 18, 2026 release put 2025 lightning-related homeowners claim payouts at $1.65 billion, a 59 percent jump from the $1.04 billion paid in 2024. Claims rose 11.6 percent to 61,986, so most of the increase came from severity.
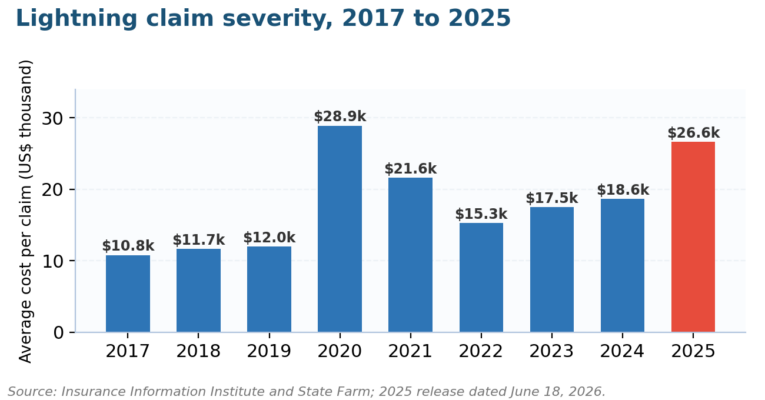
Figure 1. The average lightning claim has risen 146.9 percent since 2017, with 2025 the second-highest year on record, per Triple-I and State Farm.
The average claim reached $26,616 in 2025, up 42.8 percent in a single year and 146.9 percent since 2017. Texas produced the largest bill at nearly $253 million in insured losses and an average claim of $60,382, while Florida led on frequency with 5,167 claims. Triple-I attributes the severity to rebuilding costs and the value of connected electronics.
Strike counts moved the same direction. Vaisala Xweather’s 2025 report, released January 5, 2026, recorded 252 million lightning strikes in the United States, a 20 percent rise on 2024 and an eight-year high. Texas logged 47 million events, and Shady Grove, Oklahoma, posted the year’s highest density at 3,005 events per square mile.
|
Indicator |
2025 figure |
Change |
Source |
|
Homeowners lightning claim payouts |
$1.65 billion |
+59% on 2024 |
Triple-I, June 2026 |
|
Number of lightning claims |
61,986 |
+11.6% on 2024 |
Triple-I, June 2026 |
|
Average cost per claim |
$26,616 |
+42.8% on 2024 |
Triple-I, June 2026 |
|
US lightning strikes detected |
252 million |
+20% on 2024 |
Vaisala Xweather, January 2026 |
|
Highest state lightning density |
Florida, 305 per sq mi |
Oklahoma second at 253 |
Vaisala Xweather, January 2026 |
|
US lightning deaths |
21 |
10-year average of 20 |
National Weather Service |
Commercial losses are less frequent and larger. FM’s Data Sheet 5-11 records 959 lightning losses at client properties over the ten years through 2024. Twenty-two building fires cost $86.67 million between them, six wildfire losses cost $143.48 million, and a single furnace explosion, caused when a lightning surge tripped a control system, cost $199.57 million on its own.
Two 2026 events show the R1 and R4 ends of that range. On Saturday, May 2, 2026, a two-alarm fire gutted the Marine Science Laboratory at the University of South Florida in St Petersburg, and interim regional chancellor Thomas Smith told reporters that cameras caught the bolt. The university’s May 3 update called it a probable total loss.
On Tuesday, August 11, 2026, lightning struck a walkway at the Grafton Reintegration Center in Ohio as 16 incarcerated men walked back from the dining hall. One was airlifted and seven were still in hospital the next day. Governor Mike DeWine said afterwards officers saw no sign a strike was imminent, the occupancy problem coefficient C4 exists to capture.
Deaths follow the same strike counts. The National Weather Service counted 21 lightning fatalities in 2025 against a ten-year average of 20, and 12 by June 30, 2026. The National Lightning Safety Council compiles the underlying list, and most victims were outdoors, which keeps R1 for open sites in scope alongside the operational risk examples a register already holds.
How the Annex L Simplified Method Works
With the stakes set, here is the calculation. The simplified method needs two numbers, and the first, Nd, is the annual threat of occurrence, calculated as Nd = Ng x Ad x Cd x 10^-6. Roofing Elements magazine reproduces the equations and tables, and Los Alamos National Laboratory publishes a free Annex L calculator workbook that automates them.
Ng is the cloud-to-ground flash density in flashes per square kilometer per year, read from the standard’s flash density map or Vaisala’s gridded data. Ad is the equivalent collection area, LW + 6H(L + W) + 9(pi)H^2 for a rectangular structure with L, W, and H in meters. Height matters most, since the H terms grow faster than the footprint.
|
Relative structure location |
Cd |
Effect on Nd |
|
Surrounded by taller structures or trees within a distance of 3H |
0.25 |
Quarter of the base exposure |
|
Surrounded by structures of equal or lesser height within 3H |
0.5 |
Half exposure |
|
Isolated structure, nothing within 3H |
1.0 |
Full exposure |
|
Isolated structure on a hilltop |
2.0 |
Double exposure |
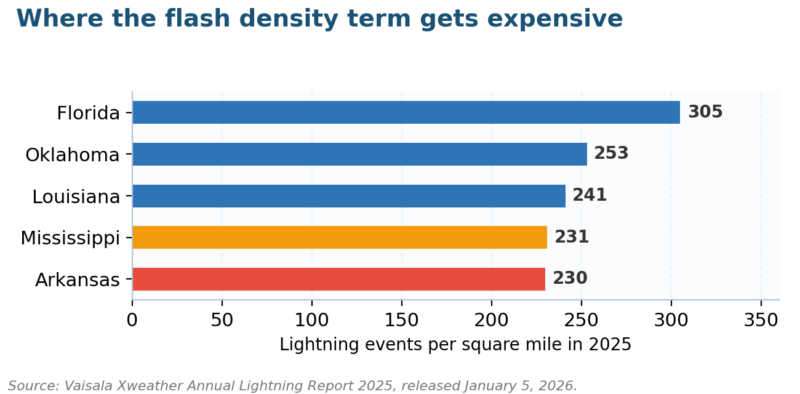
Figure 2. Vaisala’s 2025 density ranking counts all lightning events; Annex L uses the cloud-to-ground subset, but the ranking of states is the same.
One caution on Ng. Vaisala’s density figures include in-cloud lightning, while Annex L wants cloud-to-ground flashes only, so read the standard’s map or the cloud-to-ground layer and skip the headline total.
The likelihood definition in any other assessment does the same job this number does here: it converts a hazard into an expected frequency.
The second number, Nc, is the tolerable lightning frequency, and it depends on the structure alone. Nc = 1.5 x 10^-3 divided by C, where C = C2 x C3 x C4 x C5. Each coefficient scales the tolerance down as the building becomes more combustible, more valuable, harder to evacuate, or more consequential when it fails.
|
C2: structure and roof |
Metal roof |
Nonmetallic roof |
Combustible roof |
||
|
Metal structure |
0.5 |
1.0 |
2.0 |
||
|
Nonmetallic structure |
1.0 |
1.0 |
2.5 |
||
|
Combustible structure |
2.0 |
2.5 |
3.0 |
||
|
Coefficient |
Condition |
Value |
|||
|
C3 contents |
Low value and noncombustible |
0.5 |
|||
|
C3 contents |
Standard value and noncombustible |
1.0 |
|||
|
C3 contents |
High value and moderately combustible |
2.0 |
|||
|
C3 contents |
Exceptional value, flammable liquids, computers, or electronics |
3.0 |
|||
|
C3 contents |
Exceptional value and irreplaceable cultural items |
4.0 |
|||
|
C4 occupancy |
Unoccupied |
0.5 |
|||
|
C4 occupancy |
Normally occupied |
1.0 |
|||
|
C4 occupancy |
Difficult to evacuate or risk of panic |
3.0 |
|||
|
C5 consequence |
Continuity of service not required, no environmental impact |
1.0 |
|||
|
C5 consequence |
Continuity of service required, no environmental impact |
5.0 |
|||
|
C5 consequence |
Consequences to the environment |
10.0 |
|||
The decision rule is a comparison. If Nd is less than or equal to Nc, a lightning protection system is optional; if Nd is greater than Nc, the standard recommends one. Interference Technology’s worked example for a hilltop facility produced Nd of 0.428 against Nc of 0.00017, a ratio of 2,569, which leaves no doubt about the verdict.
Notice what the method leaves out. There is no 5×5 grid, no color, and no scoring committee, which makes it more defensible than the risk matrix most sites use. One coefficient choice can swing the answer by a factor of ten, so document the reasoning behind every C value as any risk assessment methodology requires.
Three Worked Examples From Tank Farm to Tool Shed
Formulas are easier to follow when applied to specific buildings, so here are three. The dimensions and flash densities below are illustrative, chosen to show how the coefficients interact; a real assessment reads Ng from the map for the actual site and measures the structure. Figure 3 plots the outcomes.
|
Input or result |
Control building at a tank farm, Oklahoma |
Brick elementary school, Georgia |
Unoccupied metal shed, Seattle |
|
Dimensions L x W x H (m) |
60 x 30 x 12 |
50 x 25 x 9 |
10 x 10 x 4 |
|
Ng assumed (flashes/km2/yr) |
8 |
10 |
0.5 |
|
Ad collection area (m2) |
12,352 |
7,590 |
1,032 |
|
Cd location |
0.5 (equal-height tanks nearby) |
0.5 (suburban) |
0.5 (trees of similar height) |
|
Nd strikes per year |
0.0494 |
0.0380 |
0.00026 |
|
C2 x C3 x C4 x C5 |
1.0 x 3 x 1 x 10 = 30 |
1.0 x 1 x 3 x 1 = 3 |
0.5 x 0.5 x 0.5 x 1 = 0.125 |
|
Nc tolerable frequency |
0.00005 |
0.0005 |
0.012 |
|
Nd / Nc |
988 |
76 |
0.02 |
|
Verdict |
Protection recommended |
Protection recommended |
Protection optional |
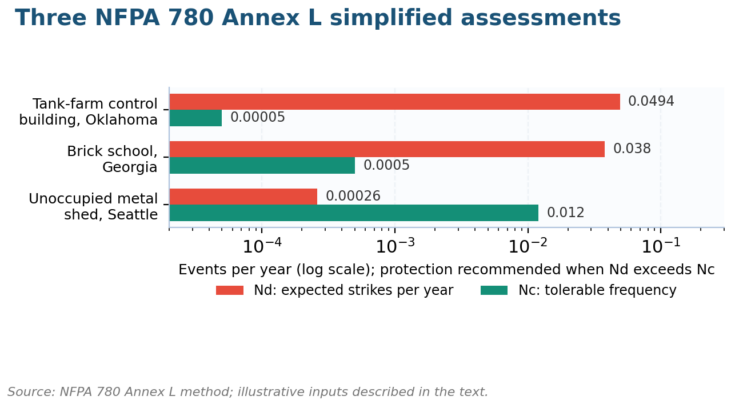
Figure 3. Nd exceeds Nc by three orders of magnitude for the control building and by 76 times for the school; only the shed clears the test.
The control building fails by the widest margin, and the driver is C5. Environmental consequences multiply the tolerance divisor by ten, and electronics with flammable liquids nearby add another factor of three. That combination is the Glenpool profile, and it is why FM’s data sheet tells clients to protect buildings that process ignitable liquids with lightning rods to NFPA 780.
The school result is less obvious. Brick walls, ordinary contents, and no environmental exposure still produce a tolerance of one strike every 2,000 years, because C4 for a building that is difficult to evacuate is 3. Grafton’s walkway strike was on people outdoors, but the same coefficient governs any occupancy where a panic or a slow evacuation is plausible.
The shed passes by a wide margin, which is the correct result. A small, unoccupied, noncombustible structure in a low-density region does not justify a system, and writing that conclusion down is as valuable as the recommendations. Our risk assessment example and scenario-based assessment posts show how to file the negative finding.
When to Escalate to the Detailed Method or IEC 62305-2
Three verdicts, one formula, and no mention of surge damage to a $2 million control system: that gap is where the detailed method starts. Annex L’s detailed calculation separates the four components R1 to R4, estimates each as frequency times probability of damage times loss, and compares each with its own tolerable value rather than a single Nc.
Use it for critical facilities, explosives, healthcare, and anything with a service-continuity obligation. The Lightning Protection Institute’s tolerable-risk article treats the detailed route as the default for hospitals, emergency centers, server farms, and industrial plants. We agree: the simplified method tells you whether to protect, while the detailed method tells you how much protection each loss type needs.
Internationally, the reference is IEC 62305-2. Its third edition, published in 2024, replaced the 2010 text and made three changes worth knowing. It merged loss of human life and loss due to fire into a single risk, introduced a frequency-of-damage measure for internal systems, and replaced flash density Ng with ground strike-point density NSG when counting dangerous events.
|
Feature |
NFPA 780 Annex L simplified |
NFPA 780 Annex L detailed |
IEC 62305-2:2024 |
|
Output |
Yes or no on a lightning protection system |
R1 to R4 against tolerable values |
Single combined risk plus damage frequency |
|
Strike frequency input |
Ng cloud-to-ground flash density |
Ng plus service-line exposure |
NSG ground strike-point density |
|
Best for |
Ordinary commercial and residential structures |
Critical, explosive, heritage, and healthcare sites |
Multinational portfolios and EU-regulated assets |
|
Mitigation credit |
None beyond the C coefficients |
Protection level and SPD probability factors |
Protection level, SPDs, and IEC 62793 warning systems |
|
Typical effort |
One afternoon with the calculator |
Several days with a designer |
Specialist software and site survey |
The NSG change matters when reconciling US and European assessments of one site, because strike-point counts run higher than flash counts once a flash with several ground contacts is counted correctly. Biral’s summary also notes that the 2024 edition credits IEC 62793 thunderstorm warning systems as an active mitigation, an option NFPA 780 does not score.
For geometry, the standards converge on the rolling sphere. NFPA 780 uses a 150-foot sphere for ordinary structures and a 100-foot sphere for explosives storage; modelling software rolls it over a 3D model to find unprotected surfaces. Treat that output as a design check and keep the risk decision in the complete risk assessment guide format your auditors recognize.
What the 2026 Edition Changes for Protection and Inspection
Once the assessment recommends protection, the rest of NFPA 780 governs the system. NFPA’s description of the 2026 edition lists revised inspection intervals, new and revised definitions, surge protection updates, changes to the lightning risk assessment annex, and recommendations for critical facilities.
It also adds requirements for athletic scoreboards and recognizes lightning electromagnetic pulse as an ignition source.
Smaller items include clarified conductor rules, revised airfield lighting circuits, watercraft zone-of-protection changes for carbon fiber masts, and a revised Annex N on nonmetallic tanks holding flammable vapors or liquids. The standard sits on a three-year cycle, so the NFPA 780 development page is where public inputs for the next edition will open.
|
System component |
What it does |
Where the rules live |
|
Strike termination (air terminals) |
Intercepts the flash before it reaches roof materials or rooftop equipment |
NFPA 780 Chapter 4; UL 96 components |
|
Main and down conductors |
Carries current from terminals to earth along a low-impedance path |
NFPA 780 Chapter 4; LPI 175 |
|
Grounding electrodes |
Dissipates current into the earth; target resistance set by soil and design |
NFPA 780 Chapter 4; IEC 62305-3 for EU sites |
|
Bonding and equipotential connections |
Stops side flashes between the system and metal bodies inside 3H |
NFPA 780 Chapter 4, interconnected metallic objects |
|
Surge protective devices |
Limits transient overvoltage on power, data, and antenna lines entering the structure |
NFPA 780 Chapter 4; FM DS 5-11; UL 1449 |
|
Third-party certification |
Independent inspection of the installed system |
UL Master Label; LPI-IP Master Installation Certificate |
Certification is where owners get their evidence. The LPI-IP inspection program issues a Master Installation Certificate after an independent field inspection, and LPI’s certified designers and inspectors are the people who should sign the assessment. A system without a certificate is a control measure nobody has verified.
Inspection cadence is the change most facility teams will feel, and practitioner guidance summarized by HV Hipot puts NFPA 780 at annual visual checks with full inspections, including ground resistance testing, every three to five years. IEC 62305 asks for full inspections every two to four years and six-monthly checks in explosive atmospheres.
The fire statistics explain the emphasis. NFPA’s Lightning Fires and Lightning Strikes report estimated 24,600 lightning fires a year in the United States during 2004 to 2008, causing 12 civilian deaths, 47 injuries, and $407 million in direct property damage annually.
Only 18 percent were home fires, yet those caused most of the losses, the same severity skew Triple-I now sees in claims.
Pair the inspection cadence with your fire risk assessment cycle and keep the two in step, since a lapsed lightning protection system is an ignition source the fire risk assessment may not record.
Running an NFPA 780 Lightning Risk Assessment at Your Facility
Standards and statistics explain why; this section explains how. An NFPA 780 lightning risk assessment takes an afternoon for a simple structure once the inputs are in hand, and the inputs are the part that gets skipped. Gather the following before opening the calculator:
- Length, width, and height in meters for each structure, including rooftop equipment that raises the effective height
- Cloud-to-ground flash density Ng for the site, from the NFPA 780 map or the Vaisala cloud-to-ground layer
- Surroundings within 3H: taller buildings, trees, open ground, or a hilltop, which set Cd
- Construction and roof materials, contents value and combustibility, occupancy type, and continuity or environmental obligations, which set C2 to C5
- Records of any existing lightning protection system, surge protective devices, certificates, and prior strike events
With inputs collected, the assessment runs in six steps that map onto the generic risk assessment flowchart. Each step ends in a written record, because the value of the exercise is the file, and an auditor or insurer will ask for it long after the calculation is forgotten:
- Compute Ad from the dimensions and Nd from Ng, Ad, and Cd
- Choose and justify C2, C3, C4, and C5, then compute C and Nc
- Compare Nd with Nc and record the verdict, the ratio, and the sensitivity to the least certain coefficient
- Escalate to the detailed method or IEC 62305-2 where R1 or R2 exposure is material
- Specify the system to NFPA 780 Chapter 4 and commission a certified installer and inspector
- Enter the residual risk, the certificate, and the inspection dates in the risk register
Ownership belongs to whoever owns the building risk, usually the facilities lead, with an LPI-certified designer doing the calculation and a lightning protection contractor doing the work. Roofing Elements puts an installed system at less than 1 percent of building cost, so the assessment fee is minor. The hazard identification practices in use should feed the C3 and C5 choices.
Integration is what separates a compliance exercise from risk management. The Nd/Nc ratio belongs in the risk register as a scored entry, the inspection dates belong in the energy and utilities KRI set or the construction KRI set, and the loss-of-service scenario belongs in the business continuity plan. Insurers increasingly ask for the same file.
Reassess on triggers as well as on the calendar, because a building changes faster than a five-year review cycle notices. Our guide on how often risk assessments should be conducted applies here, and the lightning-specific triggers are short enough to list in full:
- Change of occupancy or use, especially to anything difficult to evacuate
- Roof replacement, rooftop solar, new antennas, or HVAC that raises height H
- New flammable, explosive, or high-value electronic contents
- A known strike, a surge-related equipment failure, or an insurer request
- A new edition of NFPA 780 or IEC 62305-2, or five years since the last assessment
For a documented template, the physical security risk assessment report format adapts well, and the physical security risk management guide shows where lightning sits among site hazards. The risk assessment templates library has the register and scoring sheets that hold the output.
NFPA 780 Lightning Risk Assessment: Your Questions Answered
What is an NFPA 780 lightning risk assessment?
An NFPA 780 lightning risk assessment is the Annex L procedure in the NFPA standard for lightning protection systems. It estimates the expected annual strikes to a structure (Nd) from flash density, collection area, and location, then compares that figure with a tolerable frequency (Nc) set by construction, contents, occupancy, and consequences. Protection is recommended when Nd exceeds Nc.
Is an NFPA 780 lightning risk assessment required by law?
NFPA 780 is a voluntary standard unless a jurisdiction, an insurer, or a client specification adopts it, and Annex L is informative, and optional, even then. Federal agencies, utilities, and data-center owners require it by contract, and a negligence claim after a fire is hard to defend without a documented NFPA 780 lightning risk assessment on file.
How often should an NFPA 780 lightning risk assessment be repeated?
Repeat the NFPA 780 lightning risk assessment whenever the inputs change: new occupancy, roof or rooftop equipment that alters height, new flammable or high-value contents, a known strike, or a new edition of the standard. Absent a trigger, five years is a sensible ceiling, and the installed system needs annual visual inspection with full testing every three to five years.
Who is qualified to perform an NFPA 780 lightning risk assessment?
Anyone can run the simplified arithmetic, but a defensible NFPA 780 lightning risk assessment should be signed by a Lightning Protection Institute certified designer or inspector, or a professional engineer familiar with the standard. Installation then goes to a certified contractor, and the finished system should carry a UL Master Label or an LPI-IP Master Installation Certificate.
How does an NFPA 780 lightning risk assessment differ from IEC 62305-2?
The NFPA 780 lightning risk assessment compares one expected strike frequency with one tolerable frequency in its simplified form, and four loss components in its detailed form. IEC 62305-2:2024 merges loss of life and fire into a single risk, adds a damage-frequency measure for internal systems, and uses ground strike-point density NSG in place of flash density Ng.
What inputs does an NFPA 780 lightning risk assessment need?
Six inputs drive an NFPA 780 lightning risk assessment: structure length, width, and height; the cloud-to-ground flash density for the site; and the surroundings within three times the height. Add construction and roof materials, contents value and combustibility, and occupancy together with any continuity or environmental obligation. Records of existing protection and past strikes complete the file.
What Goes Wrong and the Fixes That Work
Most flawed assessments we see share a handful of errors, and almost all of them sit in the inputs rather than the formula. The table below pairs each with the correction that costs least, so that the next review of the file takes minutes and needs no second site visit.
|
Failure pattern |
What it does to the answer |
Fix |
|
Using total lightning density for Ng |
Overstates Nd by including in-cloud events |
Read the cloud-to-ground map or layer only |
|
Measuring height to the roof, not the equipment |
Understates Ad, since 9H^2 grows with the tallest point |
Include rooftop units, masts, and scoreboards in H |
|
Defaulting C4 to normally occupied |
Misses schools, prisons, and venues where evacuation is slow |
Ask how long a full evacuation actually takes |
|
Setting C5 to 1 for a site with drains to a watercourse |
Understates tolerance divisor by a factor of ten |
Check environmental permits before choosing C5 |
|
Stopping at the simplified verdict for a critical facility |
No view of R2 service loss or surge damage |
Run the detailed method or IEC 62305-2 |
|
No certificate or inspection record after installation |
The control exists on paper only |
Require LPI-IP or UL certification and log the dates |
Where Lightning Risk Management Is Heading After 2026
Note January 2027, when Vaisala’s next annual report is due, because two consecutive years of rising strike counts would turn the eight-year high into a trend that changes Ng for every assessment on file. Insurers already reflect it: the 146.9 percent rise in average claim cost since 2017 will appear in commercial property renewals.
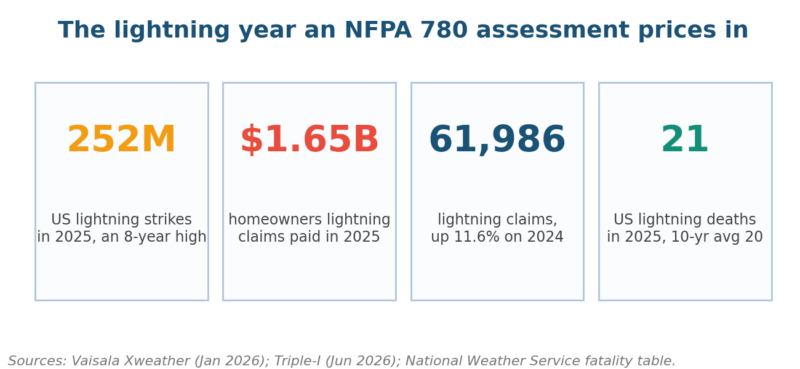
Figure 4. The 2025 numbers behind the coefficients: strike counts, claims, severity, and fatalities all above their recent averages.
Rooftops carry more equipment every year, and every panel, antenna, and heat pump raises H and adds a conductive path inside the structure. Expect the next NFPA 780 cycle to spend more of its pages on solar arrays and surge protection, and expect owners to reassess buildings that passed Annex L ten years ago with a bare roof.
Data convergence is the second change. IEC’s move to ground strike-point density gives portfolio owners one input across US and European sites, and the lightning risk assessment methods on both sides are likely to borrow from each other by the 2029 edition. Bookmark the NFPA risk assessment tool and NFPA 780 risk assessment posts for the calculators and component detail.
Organizations that want their lightning exposure assessed, scored, and filed alongside their fire, disaster recovery, and business continuity plans can send the site drawings to us. We run Annex L and the detailed method, benchmark the coefficients against ISO 31000 and the mitigation options already in place, and deliver a register entry an insurer will accept.
Browse the assessment packages on our services page, or describe the site in a few lines through the contact page and we will return a scoped proposal within five working days. Explorer’s Glenpool fire shows what an unassessed exposure costs; the cheaper option is to apply the risk management techniques first.

Chris Ekai is a Risk Management expert with over 10 years of experience in the field. He has a Master’s(MSc) degree in Risk Management from University of Portsmouth and is a CPA and Finance professional. He currently works as a Content Manager at Risk Publishing, writing about Enterprise Risk Management, Business Continuity Management and Project Management.