
Risk assessment for energy projects works best when it starts with the base rate rather than the register: establish what comparable energy projects in that technology actually cost and how late they ran, then assess the project-specific technical, financial, permitting, grid and political risks against that benchmark, and set contingency from the evidence.
Georgia Power’s Vogtle Units 3 and 4 were approved in 2009 at roughly $14 billion for two reactors. They entered commercial service on July 31, 2023 and April 29, 2024, about seven years late, at a total closer to $35 billion.
| Risk Assessment for Energy Projects: Key Takeaways |
| The strongest predictor of an energy project’s cost outcome is not in any risk register. It is the technology’s modularity, and it can be looked up before the register exists. |
| Across roughly 16,000 projects, average cost overruns run 120 percent for nuclear, 75 percent for hydro dams, 16 percent for fossil plants, 13 percent for wind, 8 percent for transmission and 1 percent for solar. |
| Vogtle Units 3 and 4 were approved at roughly $14 billion and cost about $35 billion, entering service seven years late in July 2023 and April 2024. |
| Reference class forecasting prices the risks nobody listed, by using the actual outturn of comparable energy projects instead of summing a register the sponsor team scored. |
| Grid connection is now a schedule risk in its own right. Median time from interconnection request to operation has more than doubled, and about 2,290 GW sat in US queues at the end of 2024. |
| Assess the delivery model alongside the technology. Repeatable scope, a proven EPC and firm equipment slots move outcomes more than any additional line in the register. |
Every category in a standard risk assessment was on that project from the very beginning. Technical, financial, political, regulatory and supply chain risks were all identified, rated and reported quarterly by competent people holding real budgets and real decision authority.
The assessment still missed the answer, and the reason is uncomfortable for the profession. The single best predictor of the outcome was available in 2009 without a workshop: bespoke nuclear construction has the worst cost record of any project type ever measured.
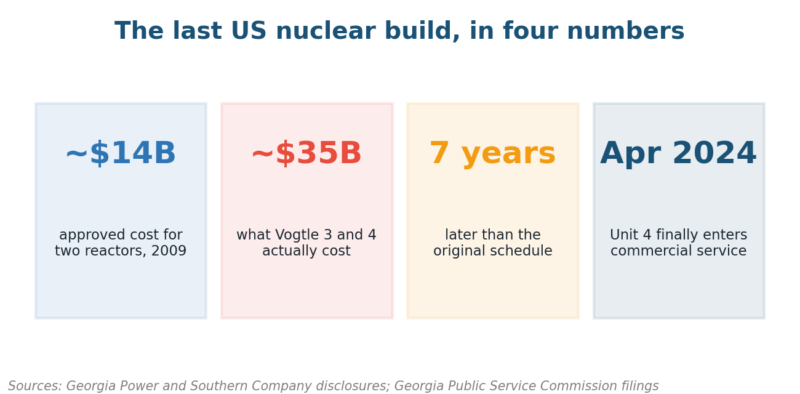
Figure 1. Cost escalation on one of the largest US energy projects: fifteen years of construction, and a number nobody forecast.
What Makes Risk Assessment for Energy Projects Different
Energy projects share the features that make capital projects hard, then add several of their own. The combination is why generic project templates underperform on energy projects and why the category lists in most articles, including the version this one replaces, add so little.
| Feature | Why it raises risk | What the assessment must do differently |
| Long build cycles | Five to fifteen years exposes the project to full commodity and rate cycles | Model escalation explicitly, not as a single contingency line |
| Single-asset concentration | One site carries the whole investment case | Treat site-specific failure as a solvency question, not a project one |
| Regulated revenue | Rate recovery and tariffs are decided outside the project | Assess the regulator as a counterparty with its own timeline |
| Grid dependency | The asset is worthless until it is connected | Track interconnection as a critical path item from day one |
| Policy-linked economics | Tax credits and incentives carry statutory deadlines | Date-stamp every incentive assumption in the model |
| Long-lead equipment | Transformers and turbines have multi-year lead times | Secure slots before financial close, not after |
The last two rows did not exist in any meaningful way when the original version of this page was written. Both now sit near the top of the risk list for US developers, and neither is well served by a probability-and-impact score.
The Risk Your Register Will Miss
Bridging from the list to the problem with lists: a risk register can only ever contain risks that somebody thought of, and it is scored by the people who want the project approved. Those two facts together produce a predictable bias.
Bent Flyvbjerg calls the second half of this uniqueness bias, the conviction that your project is different enough that other projects’ outcomes simply do not apply to it. Energy sponsors are unusually prone to this one, because every site genuinely is different.
The pattern repeats consistently enough across capital projects that you can predict it before opening the papers. Watch for these five symptoms in the risk assessments for energy projects you are asked to review, challenge or approve at an investment committee meeting:
- The register lists twenty risks and the outcome is driven by an unlisted twenty-first
- Probability scores cluster at medium, because medium is the least contestable answer in a room
- Contingency lands at 10 to 15 percent because that is what the last paper said, not what the data says
- The base case assumes first-of-a-kind performance from a first-of-a-kind build
- Schedule float is consumed before the first pour, and never restored
None of this means risk registers are useless. It means the register handles known risks on energy projects well and systematically underprices the class-level risk, which is exactly the part that sank Vogtle and which optimism bias research has documented for decades.
Technology Choice Is the Biggest Single Predictor
Here is the evidence that should reframe how these assessments open. Flyvbjerg’s database of roughly 16,000 projects across 136 countries shows cost performance varying enormously by technology, in a pattern that holds steady across decades, continents, sponsors and contracting models.
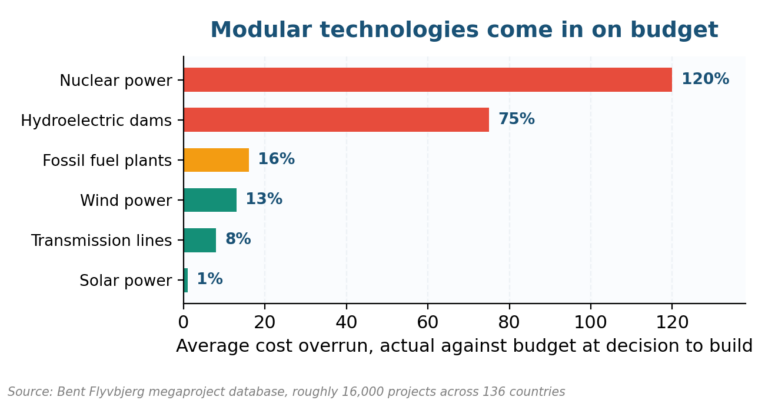
Figure 2. Cost overrun by technology across 16,000 projects. Same industry, same contractors, wildly different outcomes for energy projects.
The explanation is modularity, and it is not complicated. Solar and wind are assembled from thousands of identical factory-built units, so each repetition teaches the crew something and errors stay small and local, while a reactor is effectively a prototype poured in place.
| Technology | Avg overrun | What the number is telling you |
| Solar power | 1% | Highly modular, factory-built, thousands of repetitions per site |
| Transmission lines | 8% | Repeatable spans; risk concentrates in easements and permitting |
| Wind power | 13% | Modular turbines, but heavy lift and foundations add site variance |
| Fossil fuel plants | 16% | Mature designs, though large single components carry schedule risk |
| Hydroelectric dams | 75% | Geology is discovered during construction, not before |
| Nuclear power | 120% | Effectively bespoke, with regulatory change mid-build |
Use this at screening on energy projects, before the register opens. If a portfolio committee is choosing between technologies, the honest input is the base rate for each, and our guide to qualitative versus quantitative assessment covers when to convert that into a modelled range.
Reference Class Forecasting: Pricing the Risk You Cannot List
If the dominant risk is invisible to the register, then contingency cannot sensibly be built from the register either. Reference class forecasting solves this by ignoring the project’s own narrative entirely and using the recorded outturn of a comparable group instead.
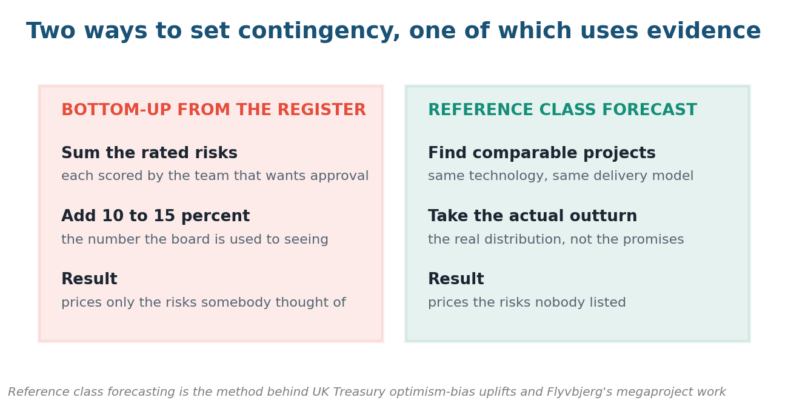
Figure 3. Two ways to price contingency on energy projects. One method asks the team. The other asks the record.
| Step | What you do | Practical note for an energy project |
| 1 | Define the reference class | Same technology and delivery model; 20 or more comparable energy projects if you can get them |
| 2 | Collect actual outturns | Cost and schedule at completion against sanction, not against the latest revision |
| 3 | Build the distribution | Report P50 and P80, since the mean hides a long right tail |
| 4 | Place your project in it | Argue explicitly for any adjustment, with evidence, not with optimism |
| 5 | Set contingency at the chosen percentile | P80 for a first-of-a-kind build; P50 only for genuinely repeat scope |
| 6 | Report both numbers to the board | The bottom-up estimate and the class-based one, with the gap explained |
Step six is the one that changes decisions. When a board sees a bottom-up estimate of $2.1 billion against a class-based P80 of $3.4 billion, the conversation stops being about whether the team is confident and starts being about whether the gap is defensible.
This is not an exotic academic technique. The UK Treasury has required optimism bias uplifts on public capital appraisal for many years now, and the method transfers cleanly across to the private investment committees that sanction energy projects weighing a sanction decision of their own.
How to Run a Risk Assessment for Energy Projects
With the base rate established, the project-specific work still matters a great deal, and this is the sequence we use to structure risk assessments for energy projects. It is designed to run alongside the standard project management process rather than replacing any part of it.
| Step | What you do | Who owns it | Output |
| 1 | Set the reference class and the base rate | Risk lead and finance | P50 and P80 outturn range |
| 2 | Confirm the delivery model and contracting strategy | Project director | Documented risk allocation by contract |
| 3 | Run structured identification by phase, not by category | Full project team | Phase-tagged risk list |
| 4 | Quantify the top exposures with ranges | Risk lead | Monte Carlo or scenario output |
| 5 | Test the grid and permitting critical path separately | Development lead | Dated interconnection and permit milestones |
| 6 | Date-stamp every policy and incentive assumption | Finance | Assumption register with expiry dates |
| 7 | Set contingency from the class, adjusted with evidence | Sponsor and board | Approved contingency with rationale |
| 8 | Re-run at each stage gate with updated actuals | Risk lead | Trend against the original base rate |
Step three is a deliberate departure from the original article’s five neat categories. Identifying by project phase surfaces the handover risks that category lists reliably hide, because most failures on energy projects happen at the seams between development, construction and commissioning.
Step eight is what turns this into a system rather than a document. Tracking actual spend against the class-based curve gives an early warning that no project risk indicator set will give you on its own, and our eight-step project risk assessment guide covers the general mechanics.
The Queue, the Transformer, and Other Modern Schedule Killers
Two risks now dominate the schedules of US energy projects that barely registered on anyone’s list a few years ago. Neither one is exotic, and both are routinely missing from assessment templates that were written before 2022 and then never revisited since.
Grid interconnection is the first. Berkeley Lab’s Queued Up analysis shows median time from interconnection request to commercial operation more than doubling, from under two years for energy projects built between 2000 and 2007 to over four years for those built from 2018 onward.
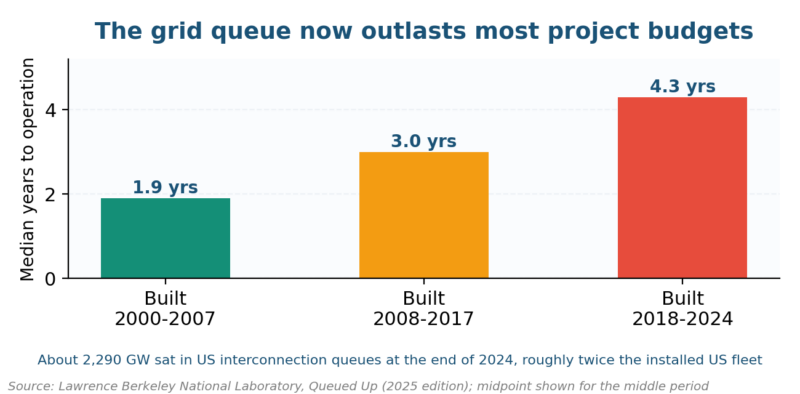
Figure 4. Interconnection delay now sets the timetable for many energy projects, because a four-year queue outlasts most construction schedules.
The scale is the point. About 2,290 GW of capacity sat in US queues at the end of 2024, close to twice the entire installed generating fleet, which tells you most of that pipeline will never be built and that queue position is a real asset.
Long-lead equipment is the second of the two. Large power transformers and high-voltage equipment now carry lead times measured in years rather than months, so an order placed after financial close can define the commissioning date regardless of construction progress.
| Modern risk | How it actually bites | What to do at assessment stage |
| Interconnection queue | Study delays and cost reallocation push operation years out | Model queue position and withdrawal scenarios explicitly |
| Network upgrade costs | Assigned upgrade costs can exceed project economics | Set a walk-away threshold before entering the queue |
| Transformer lead times | Ordering after close sets the commissioning date | Reserve slots early; price the deposit as risk spend |
| Incentive deadlines | Statutory dates for tax credits do not move | Track safe-harbour dates as hard milestones |
| Interest rate exposure | Long builds carry rate risk across the whole cycle | Test the model at rates well above the base case |
| Curtailment | Output is lost where the network is constrained | Assess congestion at the node, not at the region |
Both risks share a structural feature worth naming explicitly. They sit outside the control of energy projects and squarely inside the critical path, which is exactly the combination that a probability-times-impact score handles worst and that a dated milestone handles rather well.
Common Questions About Risk Assessment for Energy Projects
What are the main risk categories for an energy project?
Energy projects carry technical, financial, regulatory and permitting, grid and interconnection, supply chain, environmental, and political or social licence risk. Categories help with coverage, though they do not prioritise, which is why we identify by project phase and then tag each risk to a category afterwards.
How do you assess cost overrun risk on an energy project?
Start with the base rate for the technology rather than with the register. Build a reference class of comparable completed energy projects, take their actual outturn against the original sanction estimate, and set contingency from that distribution at P80 for anything first-of-a-kind.
Which energy technologies carry the highest project risk?
Among energy projects, nuclear and large hydro carry by far the worst cost records, averaging 120 percent and 75 percent overruns respectively. Solar, transmission and wind perform best, mainly because they are modular and repetitive rather than because their sponsors manage risk any better.
When should the risk assessment start?
At screening, before technology selection is locked. Once the technology and site are fixed, most of the cost distribution on energy projects is already determined, and the assessment can only manage what remains. Our guide to the first step in the risk management process covers the scoping stage.
How should interconnection risk be assessed?
As a dated critical path item with its own milestones, never as a single register line. Model queue position, study timelines, assigned network upgrade costs and a withdrawal scenario, and then set a clear walk-away threshold before you commit any development capital.
Do you need quantitative modelling, or is a matrix enough?
A matrix is adequate for screening and useless for setting contingency on a capital-intensive build. Once the investment decision involves real money, quantify the top exposures with ranges. The 5×5 versus 4×4 matrix comparison explains where qualitative scoring stops being useful.
Who should own the risk assessment on an energy project?
A risk lead independent of the delivery team, reporting to the sponsor or investment committee rather than the project director. If the person producing the numbers reports to the person whose project needs approval, the optimism bias has no counterweight.
Lessons from Energy Projects That Failed
Seven patterns recur across the post-mortems of failed energy projects worth reading, from Vogtle onward, and every single one of them is visible at the assessment stage if somebody is genuinely looking for it rather than simply assembling a paper for approval.
| Pitfall | How it shows up | The counter-move |
| First-of-a-kind priced as nth-of-a-kind | Learning-curve savings assumed on unit one | Price unit one at the class P80; take savings later |
| Contingency set by convention | 10 to 15 percent with no derivation | Derive it from the reference class and show the working |
| Grid treated as an administrative step | Interconnection appears as one register line | Give it a dated critical path of its own |
| Escalation folded into contingency | One number covers two different exposures | Model escalation separately with published indices |
| Optimistic regulator timelines | Approval assumed at the statutory minimum | Use the regulator’s actual median, not its target |
| Risk owner is the project director | The person seeking approval scores the risks | Independent risk lead reporting to the sponsor |
| Register frozen at sanction | No update as actuals arrive | Re-run the assessment at every stage gate |
The first row is the most expensive and the least contested at the time it happens. Vogtle’s economics assumed the benefits of a standardized design that had never actually been built anywhere, which is a modelling assumption dressed up as an engineering fact.
The sixth row is the easiest to fix and the most resisted. Independence costs nothing structurally, and it is the only control that reliably counteracts the bias that produces the other six, which is why we treat it as non-negotiable on capital work.
What Changes for US Developers by 2030
Three shifts are already reshaping how risk assessments for energy projects get built in the US market, and each one moves the work earlier into the project lifecycle, which is precisely where the work does most to change the eventual outcome of a project.
Interconnection reform is the biggest single variable of the three. FERC’s move to cluster study processes is intended to clear the backlog, and whether it actually succeeds will determine whether the four-year median holds or compresses over the rest of this decade.
Load growth is changing which risks actually bind. Data center demand is pulling new generation and transmission forward at a pace that now makes equipment availability and skilled labor, rather than capital, the binding constraint on a great many US energy projects.
Base rates are becoming standard practice at investment committees rather than an academic technique. We expect a class-based contingency figure alongside the bottom-up estimate to be a routine paper requirement well before 2030, much as NERC reliability assessments became routine inputs.
If your last board paper on energy projects showed contingency at fifteen percent with no derivation, the number is decoration. We build reference classes for energy projects, quantify the top exposures with ranges, and give the investment committee both figures with the gap explained. Read our services, then get in touch with the technology and the sanction estimate.

Chris Ekai is a Risk Management expert with over 10 years of experience in the field. He has a Master’s(MSc) degree in Risk Management from University of Portsmouth and is a CPA and Finance professional. He currently works as a Content Manager at Risk Publishing, writing about Enterprise Risk Management, Business Continuity Management and Project Management.