Project portfolio risk management is the discipline of identifying, scoring, and responding to risks across every project an organization runs. Managed together, the collection delivers the strategy even when single projects fail. It differs from project risk management in altitude: it weighs interdependencies, reprices the portfolio on a cadence, and kills work that no longer earns its risk.
On December 10, 2024, General Motors stopped funding Cruise, the robotaxi unit it had backed with more than $10 billion since 2016. Chair and CEO Mary Barra told analysts a robotaxi business is not GM’s core business, and that scaling one would demand significant capital beyond what was already spent.
The exit was a portfolio call, and a disciplined one. GM expects about $1 billion in annualized savings, redirected into personal-vehicle autonomy where the company already sells. CNBC’s post-mortem listed Cruise among several growth bets GM has unwound as capital priorities shifted.
| Project Portfolio Risk Management: Key Takeaways |
| Project portfolio risk management works at a higher altitude than project risk: it scores every project, watches the interdependencies, and protects the strategy rather than any single schedule. |
| GM ended Cruise robotaxi development in December 2024 after investing more than $10 billion, a portfolio decision expected to free about $1 billion a year for personal-vehicle autonomy. |
| Only 50% of projects were rated successful in PMI’s Pulse of the Profession 2025, and 12% failed outright, so an unscored portfolio is carrying silent losers right now. |
| The UK now prices completing HS2 at £87.7 billion to £102.7 billion in 2025 prices, evidence that portfolio risk compounds when no one reprices it annually. |
| Four risk categories cover the portfolio: external business, internal business, execution, and interdependency risk. Score each project on budget weight times risk score. |
| PMI reissued its risk standard as a Practice Guide in September 2024; pair it with ISO 31000’s definition of risk as the effect of uncertainty on objectives. |
Most organizations never make that call because nobody scores the portfolio. Projects get approved one by one, risks get reviewed one by one, and the aggregate exposure belongs to no one. The working discipline below closes that gap: four risk categories, a portfolio-cadence process, weighted scoring, a written tolerance band, and the measurement tools that make a kill decision defensible.
What Project Portfolio Risk Management Actually Covers
Project portfolio risk management sits one level above project risk management. A project manager asks what could derail this schedule and this budget. The portfolio manager asks whether the whole collection still delivers the strategy at acceptable exposure, and which projects should grow, shrink, or stop.
ISO 31000 defines risk as the effect of uncertainty on objectives, and the objectives at this altitude are strategic: revenue targets, transformation milestones, regulatory commitments. PMI’s Risk Management in Portfolios, Programs, and Projects Practice Guide, reissued in September 2024, frames the portfolio tier as protecting value, and our review of that standard walks its structure.
The discipline also owns what single projects cannot see. Two healthy projects can share one scarce engineering team, one vendor, or one data migration, and that shared dependency is invisible on either project’s register. PMI’s research on portfolio interdependencies treats these couplings as the defining portfolio-level exposure.
| Question | Project level | Portfolio level |
| What can fail? | This schedule, budget, or scope | The strategy the projects exist to deliver |
| Who owns it? | Project manager and team | Portfolio governance group and executives |
| Core tool | Risk register and response plan | Scored portfolio, tolerance bands, reprioritization |
| Hard decision | Escalate or mitigate | Rebalance, pause, or kill a project |
Why Portfolios Fail Differently Than Projects
Projects fail loudly; portfolios fail quietly, by drift. PMI’s Pulse of the Profession 2025, surveying roughly 3,000 professionals, rated only 50% of projects successful, up from 48% in 2024, with 12% failing outright. A portfolio holding twenty projects statistically carries two failures and ten mixed outcomes today.
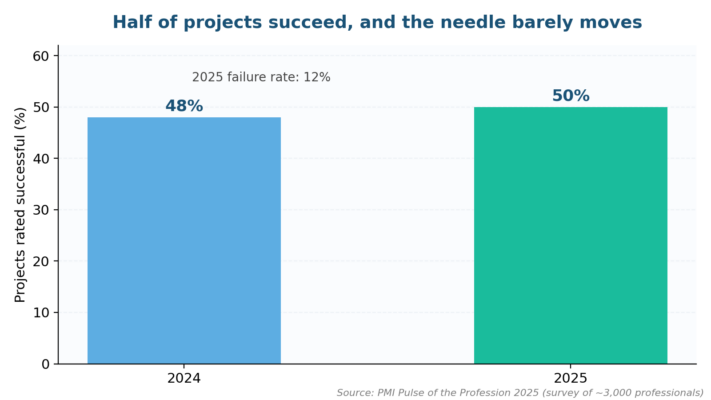
Figure 1. Success rates barely moved between 2024 and 2025, which makes portfolio-level selection the real lever (PMI Pulse 2025).
Scale makes the drift expensive. McKinsey’s analysis of large IT programs found they run 45% over budget while delivering 56% less value than promised. The pattern is portfolio-blind: each overrun was approved by a governance process looking at one business case at a time.
The public-sector version is playing out in Britain. The Department for Transport told Parliament that completing HS2 now costs £87.7 billion to £102.7 billion in 2025 prices, with full service pushed to between May 2040 and December 2043. Two-thirds of the increase traces to underestimation and inefficiency, exposures a repriced portfolio would have surfaced years earlier.
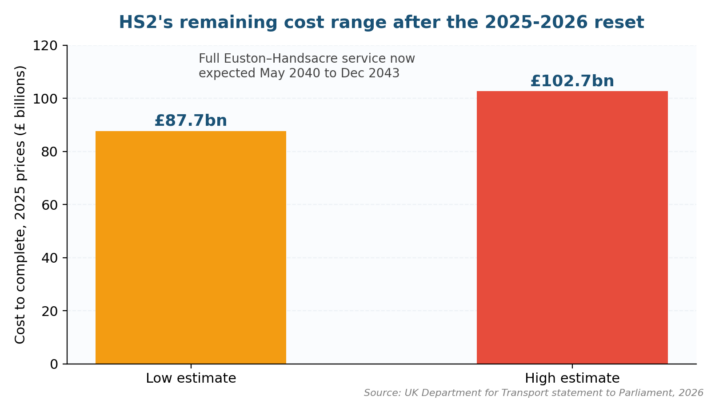
Figure 2. HS2’s remaining cost range after the reset led by CEO Mark Wild (UK DfT statement to Parliament).
The reset itself shows the discipline arriving late. The government settled £25.3 billion of funding for 2026-27 through 2029-30 and put chief executive Mark Wild in charge of rebuilding the delivery plan. In effect, the government rebuilt portfolio governance around one flagship after the exposure had compounded.
Portfolio Risk vs Project Risk: The Altitude Difference
The two disciplines share a spine and differ in scope, and confusing them is the most common failure we see in maturity assessments. Project risk protects delivery of one scope. Portfolio risk protects the value of the whole investment mix, which sometimes means accepting a project’s death.
Empirical work backs the separation. Teller and Kock’s study of 176 portfolios found that portfolio risk management quality directly predicts portfolio success, independent of how well single projects manage their own registers. A structured literature review in IJISPM reaches the same conclusion: the portfolio tier adds practices of its own beyond aggregating project registers.
The practical test is the escalation path. A risk that threatens one project’s objectives belongs on that project’s register, handled through standard risk mitigation.
A risk that threatens strategic objectives, spans projects, or exceeds a single sponsor’s authority is portfolio business, and it needs the strategic-versus-operational distinction made explicit.
The Four Categories of Portfolio Risk
Categories force coverage, exactly as they do in the five essential risk management steps. A portfolio register heavy on execution entries and silent on interdependencies is hiding its most expensive exposure. We group portfolio risk into four families and require entries in each at every review.
| Category | Typical exposures | Early indicators |
| External business | Recession, regulation, political shifts, natural events, market pivots | Leading market data, regulatory calendars |
| Internal business | Reorganizations, funding cuts, leadership churn, strategy changes | Budget variance, sponsor turnover |
| Execution | Shared-resource conflicts, vendor failure, quality gaps, delivery slippage | Milestone slip rate, resource utilization |
| Interdependency | One project’s delay cascading into dependent projects and benefits | Dependency map churn, critical-path overlap |
External shocks deserve modelling, and cheap scenario work beats prediction. Nobody priced a pandemic in 2019, yet portfolios with categorized external risk and pre-agreed triggers cut and redirected faster in 2020. The same logic applies to tariff swings and rate moves hitting capital-heavy project portfolios now.
Interdependency risk is the newest muscle for most teams. Map which projects share people, platforms, vendors, and data, then score the cascade: if project A slips a quarter, which benefits move. Key risk indicators on the shared nodes give the earliest warning available.
How the Project Portfolio Risk Management Process Works
The project portfolio risk management process runs the familiar loop, identify, assess, respond, monitor, at portfolio cadence. The nine steps of project risk management still govern inside each project; the portfolio adds a quarterly repricing rhythm and a governance group with authority to rebalance money and people.
Identification at this altitude is a different exercise from a single-project risk workshop, because the exposures that matter most live in the seams between projects. Portfolio identification therefore pulls from five distinct sources that no individual project register sees on its own:
- Aggregated project registers, filtered for risks tagged as strategic or cross-project.
- The dependency map: shared teams, vendors, platforms, and data flows.
- External scans: regulatory calendars, market indicators, and supplier financial health.
- Benefit-tracking variance: promised value that is quietly eroding across projects.
- Post-mortems from killed or completed projects across the last two cycles.
Assessment converts the findings into comparable numbers, which is where the eight-step project risk assessment scales up. Score each project’s riskiness, weight it by budget share, and rank. The scoring section below works a full example, because the arithmetic is what turns review meetings into decisions.
Response uses the standard four moves, avoid, transfer, mitigate, accept, plus two that only exist at portfolio level: rebalance and kill. GM’s Cruise decision was a kill executed cleanly, with the freed capital visibly reassigned to a strategy the board still believed in.
Monitoring then closes the loop on a fixed, published calendar: quarterly repricing of every score, monthly indicator reviews, and event-triggered reassessment whenever any category threshold trips. The GAO’s cost estimating guide and schedule assessment guide are free benchmarks for what disciplined repricing looks like.
Scoring, Risk Tolerance, and the Efficient Portfolio
Scoring turns judgment into arithmetic the governance group can argue about productively. Rate each project 1 to 5 on likelihood and impact against strategic objectives, multiply for a risk score out of 25, then weight by each project’s share of portfolio budget. The result is exposure the CFO can read.
| Project | Budget share | Risk score (/25) | Weighted exposure | Decision signal |
| Core platform migration | 35% | 16 | 5.6 | Mitigate: add contingency, split phases |
| New market launch | 25% | 20 | 5.0 | Watch: high risk, high strategic value |
| Compliance program | 20% | 8 | 1.6 | Protect: low risk, mandatory |
| Robotics pilot | 12% | 22 | 2.6 | Review quarterly against kill criteria |
| Office refresh | 8% | 6 | 0.5 | Accept: low stakes either way |
Tolerance is the line the numbers get judged against, and it is a business choice, not a formula. A biotech board tolerates a portfolio average a bank would refuse. Write the tolerance as a band, say a weighted average between 8 and 14, and force a documented decision whenever the portfolio drifts outside it.
Balance matters as much as the average, which is where quantitative risk tools help. A portfolio scoring 12 because every project scores 12 has no safe core, while one mixing 6s and 20s has both a floor and upside. Deliberate diversification across the strategic risk spectrum is the design goal.
Measuring Portfolio Exposure: VaR, ES, and Simpler Tools
Finance lends the portfolio manager three measurement ideas, and all three translate. Value at Risk states the maximum loss at a confidence level: a one-month 99% VaR of $10 million means a 1% chance of losing more than that in a month. Applied to projects, it prices the tail of your delivery risk.
| Measure | What it tells you | Portfolio use |
| Value at Risk (VaR) | Maximum loss at a confidence level | Board-level statement of delivery downside |
| Expected Shortfall (ES) | Average loss beyond the VaR point | Sizing contingency for genuine tail events |
| Standard deviation | Volatility of outcomes around the mean | Spotting portfolios with no stable core |
Expected Shortfall answers what VaR ignores: how bad the bad cases average out. Banking regulators moved market-risk capital from VaR to ES in the Basel Committee’s FRTB framework precisely because tails matter more than thresholds. Project portfolios inherit the lesson at Monte Carlo level: simulate, then read the tail alongside the mean.
Keep the simple version running too. The weighted-exposure table above, refreshed quarterly and trended, catches most drift without simulation. Teams managing software-heavy portfolios and energy project portfolios both report the same pattern: the trend line triggers the conversation, the model then sizes it.
Managing the Opportunity Side
Risk at portfolio level cuts both ways, and a register that only lists threats systematically underprices the upside. A positive risk is an uncertainty that could help objectives: a competitor exiting, a technology maturing early, a regulation opening a market. Opportunities need owners and triggers exactly as threats do.
Run opportunity intake as a standing pipeline with monthly triage. Each candidate gets the same scoring as a risk, likelihood times strategic value, and a timing window, because opportunities expire. The portfolio decision is then explicit: fund it, park it with a review date, or decline it in writing.
GM’s pivot shows both sides of one ledger. Killing Cruise closed a threat to capital discipline; folding its autonomy talent into driver-assistance products GM already sells converted the residual asset into an opportunity with nearer-term revenue. Portfolio thinking is what made the second half of that move visible.
What Goes Wrong and the Fixes That Work
Portfolio risk programs stall in recognizable ways, and most of them are governance failures at heart. The patterns repeat across the risk management examples we maintain, and each has a working fix. The table names the six we meet most often in assessments.
| Pitfall | Root cause | Remedy |
| Portfolio reviewed once a year | Risk treated as budgeting theatre | Quarterly repricing on the governance calendar |
| No kill criteria | Sunk-cost pressure on sponsors | Pre-agreed thresholds set at approval, in writing |
| Scores without budget weights | Every project argued as special | Weighted exposure as the only ranking shown |
| Interdependencies unmapped | Registers stop at project boundaries | Dependency map owned by the PMO, updated monthly |
| Tolerance never stated | Boards avoid committing to a number | Tolerance band ratified annually with the strategy |
| Opportunities ignored | Register framed as threat log | Opportunity pipeline with expiry dates and owners |
The deepest fix is structural: connect portfolio risk to the enterprise risk management framework so strategic exposure rolls up a single path to the board. An integrated approach lets the board see project bets beside operational and financial exposure, priced the same way.
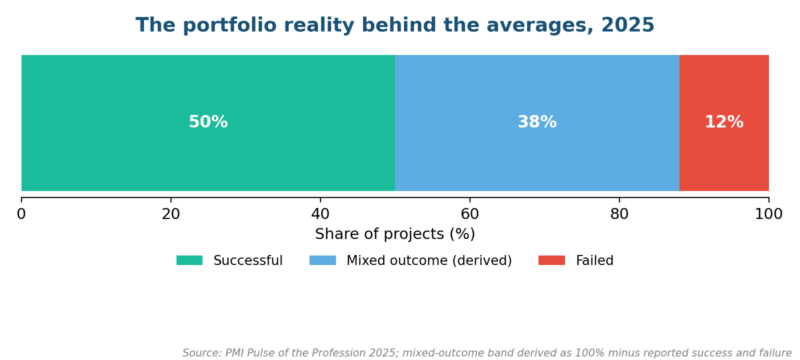
Figure 3. The 2025 outcome split: half succeed, 12% fail, and the rest land somewhere in between (PMI Pulse 2025; middle band derived).
The Project Portfolio Risk Management Questions Boards and Executives Keep Asking
What is project portfolio risk management in simple terms?
It is the practice of scoring and steering risk across every project an organization runs, so the collection delivers the strategy even when individual projects struggle. It adds two portfolio-only moves, rebalance and kill, to the standard identify, assess, respond, and monitor loop.
How is project portfolio risk management different from project risk management?
Altitude and authority. Project risk management protects one scope, schedule, and budget through a project-level register. Portfolio risk management weighs all projects together, prices interdependencies, sets tolerance bands, and holds the authority to move money between projects or stop one entirely.
What are the main categories in project portfolio risk management?
Four cover the ground: external business risk such as regulation and markets, internal business risk such as funding and leadership change, execution risk within delivery, and interdependency risk wherever projects depend on one another. Require register entries in each category at every review.
How do you measure risk in project portfolio risk management?
Start with a weighted score: rate each project’s likelihood and impact out of 25, multiply by budget share, and rank. Add Value at Risk for a board-level downside number and Expected Shortfall when tail losses matter. Trend the results quarterly; the trend triggers decisions.
What does risk tolerance mean in project portfolio risk management?
Tolerance is the exposure band the organization accepts on purpose, written as numbers, such as a weighted-average score between 8 and 14. Drifting outside the band forces a documented governance decision. Risk-hungry sectors like biotech set wider bands than banks or healthcare providers.
When should a project be killed under project portfolio risk management?
When pre-agreed criteria trip: exposure exceeding its ceiling, strategic value falling below its floor, or dependency costs outgrowing the business case. GM’s December 2024 Cruise exit is the template, criteria argued at board level, capital visibly redeployed, and the residual asset repurposed.
Three Shifts That Will Rewrite the Playbook
Watch capital discipline first. Boards that watched GM take a $10 billion lesson are now demanding kill criteria the day a project is approved. Expect portfolio governance groups to carry standing authority for mid-year rebalancing, with the September 2024 PMI Practice Guide as the reference structure.
Second, repricing is going continuous. HS2’s lesson, two-thirds of a multibillion-pound increase attributed to underestimation and inefficiency, lands the same way in every sector: annual estimates on multi-year commitments are stale on arrival. Quarterly portfolio repricing against live indicators is becoming the norm.
Third, interdependency data is becoming the differentiator. Portfolios now run on shared platforms and the same few vendors and AI providers, so the risk sits in the couplings, and mapping tools are finally affordable. Teams that master a project risk management plan per project and a dependency map across them will out-deliver bigger budgets.
If your portfolio has never been scored, weighted, and judged against a written tolerance band, that is the gap to close before the next budget cycle. Our risk advisory services build the scoring model and governance rhythm with your team. Contact us and bring your project list; the first pass takes a week, not a quarter.

Chris Ekai is a Risk Management expert with over 10 years of experience in the field. He has a Master’s(MSc) degree in Risk Management from University of Portsmouth and is a CPA and Finance professional. He currently works as a Content Manager at Risk Publishing, writing about Enterprise Risk Management, Business Continuity Management and Project Management.