
A risk assessment example shows a completed assessment: each hazard listed with who it harms, the existing controls, a likelihood-times-severity score, and the additional actions with owners and dates. This page provides five completed examples, office, construction, cyber, food service, and healthcare, all scored on a 5×5 matrix you can copy.
At the NSC Safety Congress and Expo in Denver in September 2025, OSHA announced that fall protection topped its most-cited list for the fifteenth consecutive year, with 5,914 violations of standard 1926.501 in fiscal 2025. Hazard communication followed at 2,546, ladders at 2,405.
Every one of those citations marks a workplace where the hazard was findable and the assessment either never happened or never turned into controls. Fifteen straight years at number one is not a knowledge gap; employers know falls kill, and the paperwork that forces action keeps not existing.
We built five completed examples with the same template we use in client work, each scored on an anchored 5×5, and every one of them is designed to be copied, renamed, and improved.
What a Completed Risk Assessment Example Contains
Before the examples, the anatomy. A finished risk assessment is a table, and every usable row carries the same six pieces of information; miss one and the document drifts from decision record to decoration, which is the failure the OSHA numbers keep counting.
| Element | What it records | Test for done |
| Hazard | The specific thing that can cause harm, named plainly | A stranger could find it on a walk-through |
| Who is harmed and how | The people exposed and the injury or loss mechanism | Names groups, never ‘staff’ alone |
| Existing controls | What already reduces the risk today | Verifiable on site, never aspirational |
| Score | Likelihood times severity on anchored scales | Two assessors reach the same number |
| Additional actions | What will further reduce the score, if anything | Each action has an owner and a due date |
| Review | When the assessment is checked again | A date, plus event triggers |
The scoring engine behind the examples is the standard 5×5 matrix with anchored likelihood definitions, and the row format follows the register-entry discipline used across this site. The format transfers between industries unchanged; the anchors are what make scores comparable from one assessor to the next.
Why Worked Examples Beat Blank Templates
Blank templates fail quietly, and the citation data shows the scale. A blank form transfers no judgment about what a scored row should look like, which is why OSHA’s own hazard-identification guidance pairs its process advice with filled illustrations, and why CCOHS publishes worked qualitative examples rather than empty grids.
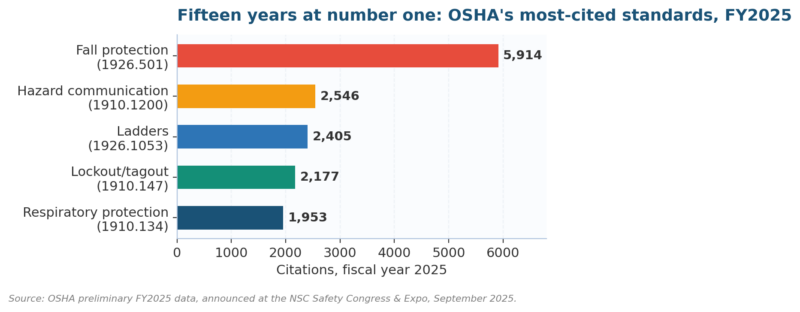
Figure 1. The FY2025 citation list: the top entries are all hazards a basic completed assessment would catch.
A worked example also calibrates scoring better than any definition. Seeing blocked fire exits scored 2×5 and trailing cables 4×2 teaches the severity-likelihood distinction in seconds, the same way BLS injury data teaches which hazards actually hurt people; abstractions teach neither.
The examples below deliberately span five settings. Copy the one nearest your world, then check the types of risk assessment guide if your decision needs a different lens entirely, quantitative, asset-based, or threat-based, before you invest in filling anything in.
Five Risk Assessment Examples You Can Copy
Each example is a compressed, completed assessment: three to four scored rows, current controls, and additional actions with owners. Scores read likelihood times severity on the anchored 1-5 scales; ratings of 15 and above demand action before work continues, 8-12 get dated actions, below 8 gets monitored.
Example 1: Office Workplace
| Hazard | Who is harmed and how | Existing controls | Score | Additional actions (owner, due) |
| Blocked fire exits | All occupants; smoke inhalation, crush in evacuation | Weekly walk-through; signage | 2×5 = 10 | Relocate storage; add exit checks to cleaning contract (Facilities, 30 days) |
| Manual handling of deliveries | Reception staff; back injury | Trolley available | 3×3 = 9 | Manual handling training; two-person rule over 15 kg (Office Manager, 60 days) |
| Trailing cables at desks | All staff; trips and falls | Cable ties at most desks | 4×2 = 8 | Cable management audit each move; under-desk trays (Facilities, 45 days) |
| Stairwell falls | All staff and visitors; fractures | Handrails; lighting | 3×4 = 12 | Anti-slip nosing; lighting sensor fix on level 2 (Facilities, 21 days) |
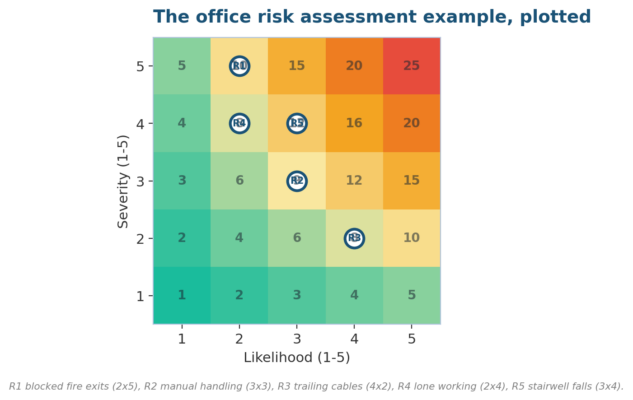
Figure 2. The office example on the matrix: same rows, visual form, ready for a management review slide.
Example 2: Construction Site (Roofing Works)
| Hazard | Who is harmed and how | Existing controls | Score | Additional actions (owner, due) |
| Falls from roof edge | Roofers; fatal or life-changing injury | Harness policy; toolbox talks | 3×5 = 15 | Install guardrails before work starts; daily anchor checks (Site Supervisor, before mobilization) |
| Falling materials | Ground crew, public; head injury | Exclusion zone; hard hats | 3×4 = 12 | Debris netting; lift plan for sheet loads (Site Supervisor, before mobilization) |
| Ladder access | All trades; falls during transit | Tied ladders; inspection tags | 3×3 = 9 | Replace two ladders past service life; stair tower for main access (PM, 14 days) |
The construction rows follow the NIOSH hierarchy of controls: guardrails (engineering) rank above harnesses (PPE), which is why the additional action on the worst row is a physical barrier, and why this example pairs with the fire risk assessment guide for site fire planning.
Example 3: Cybersecurity (Small Business Network)
| Hazard | Who is harmed and how | Existing controls | Score | Additional actions (owner, due) |
| Credential theft via phishing | Company and customers; account takeover, data exposure | Spam filter; annual training | 4×4 = 16 | MFA on all remote access; quarterly phishing tests (IT Lead, 30 days) |
| Unpatched internet-facing systems | Company; ransomware entry | Monthly patch cycle | 3×5 = 15 | Weekly scan against CISA KEV list; 72-hour patch SLA for exploited CVEs (IT Lead, 14 days) |
| Lost or stolen laptops | Customers; data breach notification | Password login | 3×3 = 9 | Full-disk encryption enforced by policy (IT Lead, 30 days) |
The cyber example is a compressed NIST SP 800-30 threat-based pass, and the second row’s action is deliberately specific: scanning against CISA’s known-exploited-vulnerabilities catalog converts a vague patching worry into a checkable weekly task with a federal reference list behind it.
Example 4: Food Service Kitchen
| Hazard | Who is harmed and how | Existing controls | Score | Additional actions (owner, due) |
| Undercooked chicken (pathogens) | Customers; illness, potential fatality in vulnerable groups | Cook temperature checks | 2×5 = 10 | Calibrated probe per shift; log verified daily per Food Code (Head Chef, 7 days) |
| Allergen cross-contact | Allergic customers; anaphylaxis | Allergen chart; separate prep board | 3×5 = 15 | Dedicated allergen prep zone; order-flag training (Head Chef, 21 days) |
| Hot oil burns | Kitchen staff; severe burns | PPE; fryer guards | 3×3 = 9 | Oil-change SOP with two-person rule (Kitchen Manager, 14 days) |
Food rows anchor to the FDA Food Code and translate directly into the HACCP scoring format if the operation runs a formal plan; the allergen row scoring 15 despite existing controls is the honest, common finding that separates real kitchens from tidy paperwork.
Example 5: Healthcare Clinic
| Hazard | Who is harmed and how | Existing controls | Score | Additional actions (owner, due) |
| Sharps injuries | Clinical staff; bloodborne pathogen exposure | Sharps bins; safety needles | 3×4 = 12 | Switch remaining lines to retractable devices; post-exposure protocol drill (Practice Manager, 30 days) |
| Patient data exposure | Patients; privacy breach, penalties | Access controls; screen locks | 3×4 = 12 | Run the HHS SRA tool annually; encrypt portable media (Privacy Officer, 45 days) |
| Infection transmission | Patients and staff; healthcare-associated infection | Hand hygiene program; PPE stock | 3×4 = 12 | Hygiene audit per CDC framework; ventilation check in treatment rooms (Clinical Lead, 30 days) |
The clinic’s data row is the seed of a full HIPAA risk assessment using the HHS SRA tool, and the infection row scales into the CDC’s infection-control frameworks for anything larger than a clinic; compressed rows are entry points, never the ceiling.
How We Filled One In: The Office Example, Step by Step
Full disclosure of method, because a worked example is only trustworthy if the work is shown. We built the office example for this page in a single timed pass with the site’s own 5×5 template and a walk-through checklist, and the sequence below is exactly what we did, in order, with nothing tidied afterward.
| Minutes | What we did | What it produced |
| 0-20 | Walk-through with the checklist: exits, storage, cables, stairs, kitchen point | Nine candidate hazards photographed and noted |
| 20-35 | Merged duplicates, dropped two trivial items, named who is harmed for each | Five hazards worth scoring |
| 35-60 | Scored each against the anchored scales, arguing likelihood from observed frequency | The five scores in the table above |
| 60-80 | Drafted additional actions, assigned owner roles and due dates | Action column, ready for sign-off |
| 80-90 | Set the review date and event triggers; final read-through | A finished, reviewable document |
Two findings from that pass are worth stealing. Scoring went fastest when we argued likelihood from observed frequency, cables get snagged weekly, evacuations happen rarely, and the hardest row to write honestly was existing controls, because aspiration keeps sneaking into that column; write only what you can verify on site today.
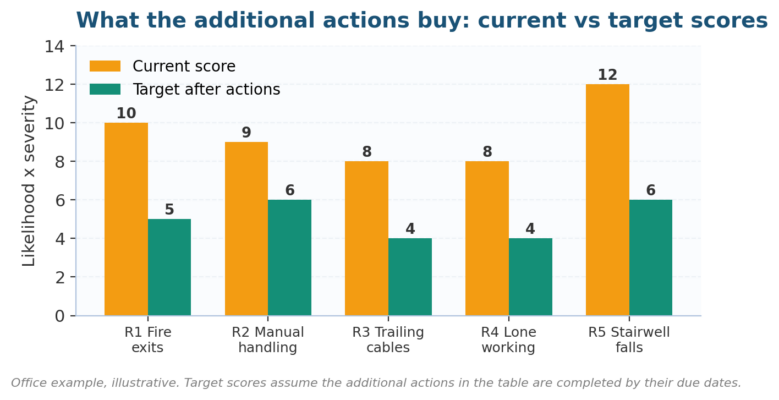
Figure 3. The point of the exercise in one chart: every additional action exists to move a bar.
The full method behind this walkthrough lives in the step-by-step risk assessment guide, the identification techniques article covers the discovery tools, and the final step in the risk identification process explains the validation and ownership discipline the action column depends on.
Reading the Scores Behind the Examples
Every score above compresses two judgments, and the bands convert them into decisions. The thresholds we use match the heat map template published on this site, and they are deliberately blunt so no committee can argue a 16 into next quarter.
| Band | Score range | Required response |
| Low | 1-7 | Monitor at scheduled reviews; no new action required |
| Medium | 8-12 | Additional actions with owners and due dates, tracked to closure |
| High | 15-16 | Act before continuing the activity; escalate to management |
| Extreme | 20-25 | Stop the activity; senior sign-off required to resume |
Score twice, always: once for today with existing controls, once for the target the actions should reach. The gap between the two bars in Figure 3 is the business case for every dollar the action column requests, which is how a completed example feeds how you manage risk at budget level.
Common Risk Assessment Example Questions Practitioners Ask
These are the questions the five examples raise in workshops when people start adapting them. Each answer front-loads the practical rule; the linked guides carry the fuller method, and the examples above stay the reference point throughout, so read the answers with the tables in view.
What is a good example of a completed risk assessment?
The office table above is the shape to copy: five specific hazards, named exposure groups, verifiable existing controls, anchored 2×5-style scores, and actions with owners and due dates. Good means auditable; a stranger should be able to check every cell against the actual workplace within an hour.
How do you write a risk assessment example for a small business?
Walk the premises with a checklist, list what could plausibly harm someone, then score each hazard on the 5×5 using observed frequency for likelihood. Ninety minutes produces a defensible first pass, as the timed walkthrough above shows; the discipline is finishing every row with an owner and a date.
What are the 5 steps shown in these risk assessment examples?
Identify the hazards, decide who might be harmed and how, evaluate the risks against existing controls, record the findings with actions, and review on a schedule. Every example on this page is those five steps compressed into one table, matching the step-by-step process in full.
Which risk assessment example applies to an office?
Example 1 covers the standard office set: blocked exits, manual handling, trailing cables, and stairwells, scored between 8 and 12. Offices rarely produce extreme scores, which makes the discipline of dated actions more important, because nothing forces urgency the way a 20 does.
How often should an example-based risk assessment be reviewed?
Annually at minimum, and immediately after an incident, a near miss, new equipment, or a layout change; the review cadence guide maps frequency to volatility. An example you copied inherits none of your history, so the first review after adoption matters most and should come early, at roughly 90 days.
Is a risk assessment example the same as a risk register?
The example is one completed assessment; the register is the living inventory that collects every assessed risk with scores, owners, and treatment status across the organization. Copy the example to start, and let its rows become register entries once ownership and review dates attach.
Six Ways Example Assessments Go Wrong
Copied examples fail in predictable ways, and we see the same six in audits of assessments that started from a template. The table pairs each failure with its tell and the correction; the first row is the one the OSHA numbers keep proving at national scale.
| Failure | The tell | Correction |
| Copied but never localized | Hazards listed that the site does not have | Walk the actual premises; delete and add rows |
| Aspirational existing controls | Controls listed that are not verifiable on site | Write only what you can point to today |
| Scores without anchors | Every row a 3×3 | Adopt written scale anchors before scoring |
| Actions without owners | Passive voice in the action column | A name and a date on every action, no exceptions |
| One-time exercise | Assessment date older than the newest equipment | Review cadence plus event triggers |
| Severity optimism | Fatal-potential hazards scored 3 severity | Severity reflects worst credible outcome, per the anchors |
The severity-optimism row deserves the last word. A fall from height is severity 5 wherever it appears, per the worst-credible-outcome logic CCOHS documents, and fifteen years of fall citations say the industry keeps scoring it lower; anchor severity to physics, and let likelihood carry the site-specific judgment.
What Better Examples Look Like by 2028
Expect completed examples to become the regulatory norm rather than the helpful extra. EPA’s risk assessment frameworks already publish worked cases alongside method, CDSE distributes a filled report template for security assessments, and inspectors increasingly ask to see your scored rows, never your blank forms.
Tooling will push the same direction. Software now drafts candidate hazards from incident feeds and photos, which makes the human disciplines in these examples, verifiable controls, anchored scores, owned actions, the differentiating work; the drafting was never the hard part, as our 90-minute pass shows. From there the full risk management steps from identification to monitoring take over, turning a worked example into a standing register.
Standards continue converging on the same anatomy: ISO 31000 for the process, IEC 31010 for the techniques, sector codes for the thresholds. The format in these five examples sits inside all of them, which is exactly why it is worth copying once and reusing everywhere.
Take one example from this page and localize it this week: walk your site, rewrite three rows, and put names in the action column. If you want the scored version reviewed or the full register built around it, our services show the engagement formats and the contact page is the fastest route to a second pair of eyes.

Chris Ekai is a Risk Management expert with over 10 years of experience in the field. He has a Master’s(MSc) degree in Risk Management from University of Portsmouth and is a CPA and Finance professional. He currently works as a Content Manager at Risk Publishing, writing about Enterprise Risk Management, Business Continuity Management and Project Management.