In June 2026 a Los Angeles jury returned $52.1 million against three trucking companies over a single 2021 crash in Santa Clarita. Hours-of-service violations sat at the centre of the case, and the nondelegable duty doctrine pulled in firms that had never employed the driver.
That verdict is what a modern fleet risk assessment has to price, and almost none of them do. The American Transportation Research Institute found insurance now costs carriers 10.2 cents per mile, up 18.6 percent since 2021, while the heavy-truck crash rate over the same period fell 2.6 percent.
Read those two findings together and the conventional logic collapses. Carriers crashed less and paid considerably more, because what prices a fleet today is the severity of the worst plausible claim rather than the running count of ordinary ones in any given year.
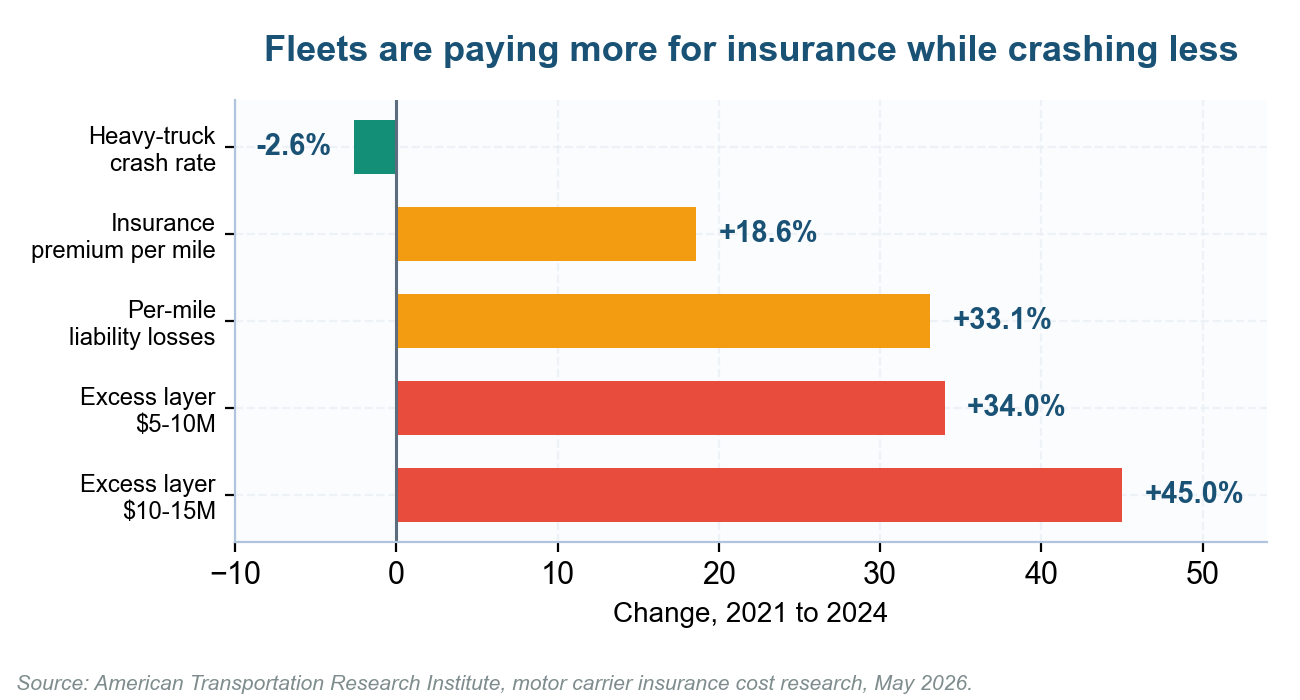
Safety performance and insurance cost have decoupled. A fleet risk assessment built only on crash counts cannot explain this.
What a Fleet Risk Assessment Actually Measures
A fleet risk assessment is a structured evaluation of the exposure created by operating vehicles and employing the people who drive them. It is not a vehicle inspection, it is not a safety meeting, and it is not the telematics dashboard somebody bought last year.
The distinction is commercial rather than semantic. An inspection asks whether this particular truck is roadworthy today, while a fleet risk assessment asks what the organization stands to lose across a full year and which controls actually move that number.
| What a fleet risk assessment is not | What a fleet risk assessment is |
|---|---|
| A pre-trip vehicle inspection | An estimate of annual expected loss by exposure domain |
| A driver toolbox talk | A ranked register with named owners and dated actions |
| A telematics dashboard | A judgement about which alerts change behaviour and which are noise |
| An insurance renewal questionnaire | The evidence base you bring to the renewal meeting |
| An annual compliance tick-box | A quarterly cycle measured on one unchanged scale |
We run these reviews for operators, and the most common finding is structural rather than technical. The fleet risk assessment sits with the safety team, the loss cost sits with finance, and nobody owns the arithmetic that connects the two, as our guide to what a risk assessment is and the complete assessment guide both argue at length.
The Loss Data Every Fleet Risk Assessment Should Start From
Before scoring anything, anchor the fleet risk assessment in published outcome data. Federal statistics tell you what actually happens to commercial fleets, which stops the exercise drifting toward whatever the loudest person in the room happens to worry about that quarter.
NHTSA counted 5,472 people killed and 153,452 injured in crashes involving large trucks during 2023. FMCSA’s Large Truck and Bus Crash Facts series puts fatal crashes at 5,476 for 2022, which still remains the most recent edition the agency has managed to publish.
The national trend is genuinely improving, which matters when you are calibrating a fleet risk assessment. NHTSA’s early estimate for 2025 shows 36,640 traffic deaths, down 6.7 percent on the 39,254 recorded in 2024, with fatalities falling in 39 states.
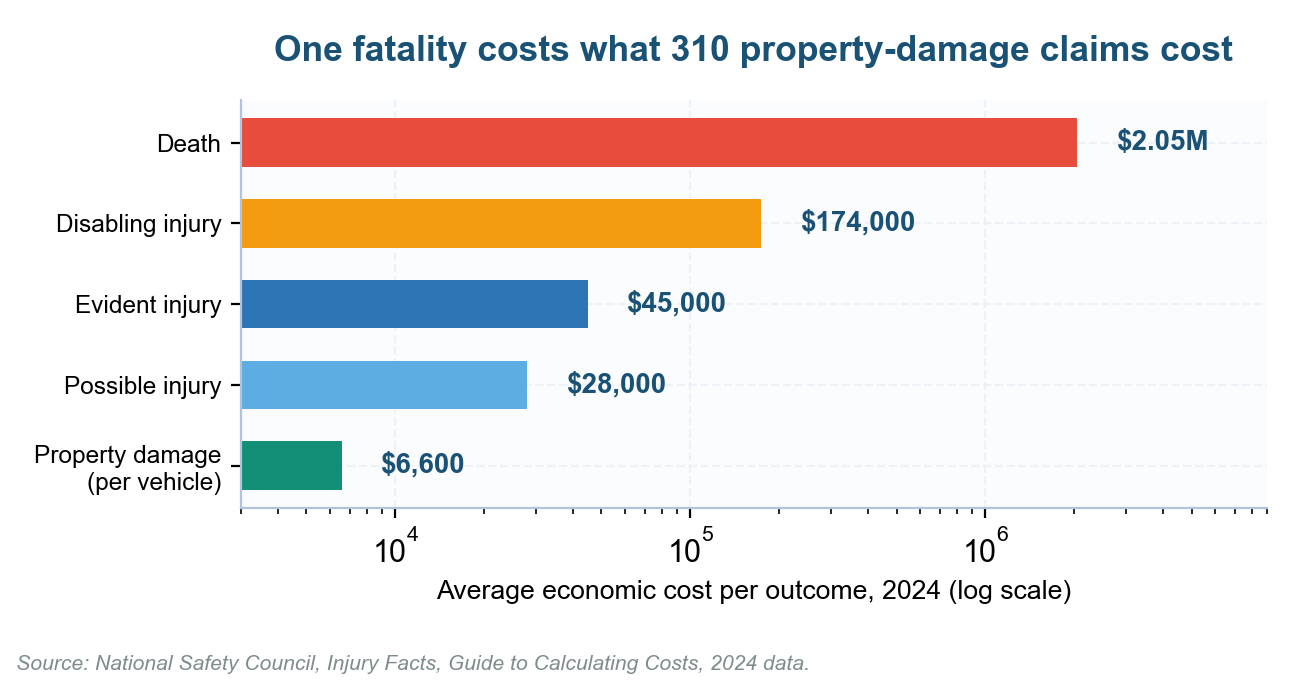
National Safety Council economic costs by crash outcome, 2024. Severity, not frequency, drives the total.
The shape of the cost curve explains why severity dominates every serious fleet risk assessment. The National Safety Council puts the average economic cost of a motor-vehicle death at $2.05 million against $174,000 for a disabling injury and $6,600 per vehicle for property damage alone.
Aggregated across the country, crashes cost the United States $559.3 billion in 2024. For employers specifically the sting is sharper, because motor-vehicle crashes are the costliest lost-time workers’ compensation claim cause at $91,433 per claim against a $47,316 all-cause average.
Fleet exposure also dominates the occupational fatality picture in a way few safety committees appreciate. The Bureau of Labor Statistics recorded 5,070 fatal work injuries in 2024, of which 1,937 were transportation incidents, and 798 were heavy and tractor-trailer truck drivers.
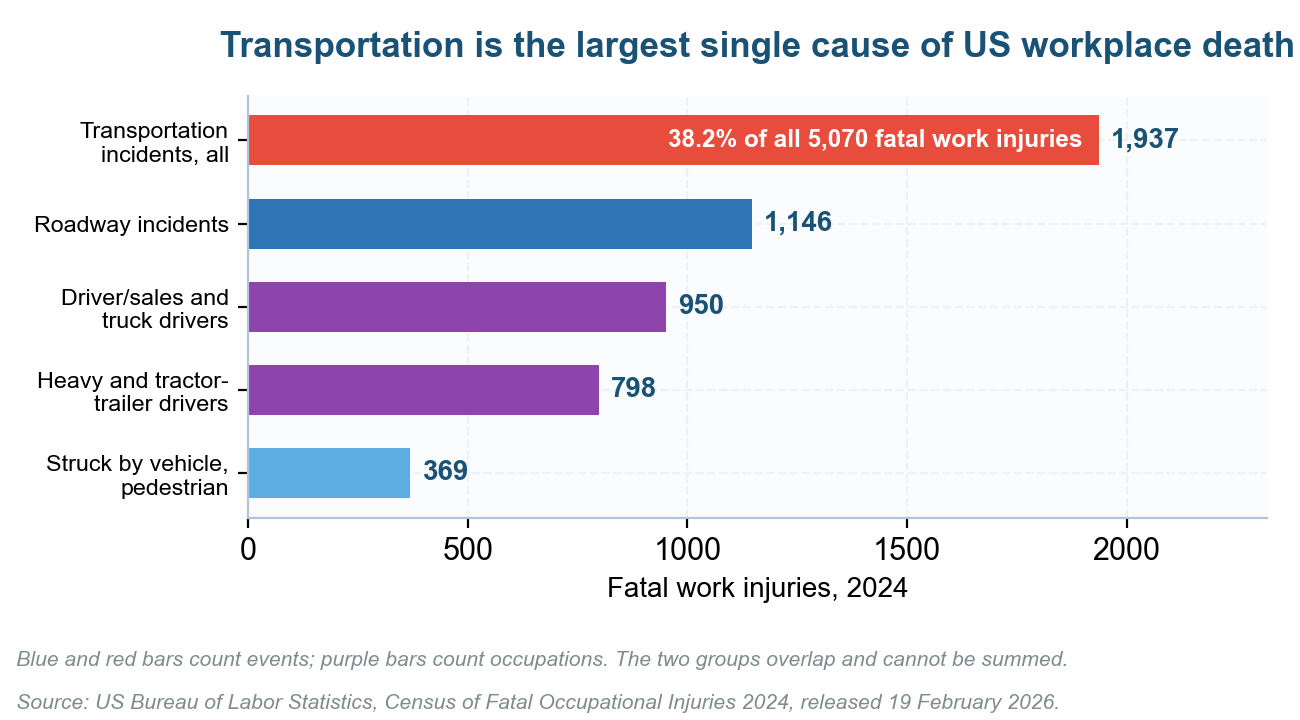
Transportation incidents account for 38.2 percent of US fatal work injuries, the largest single category.
Why Verdict Severity Now Drives Fleet Risk Assessment
Crash counts are falling while costs climb, and that only makes sense once you look at what happens in a courtroom. This is the single biggest change in fleet exposure since the first generation of fleet risk assessment templates was written.
The US Chamber Institute for Legal Reform recorded 1,288 nuclear verdicts between 2013 and 2022, carrying a median award of $21 million. Roughly one in four auto trials returning $10 million or more involved a commercial trucking company as defendant.
Insurers absorbed that shift for years and have now stopped absorbing it. AM Best recorded a fourteenth consecutive underwriting loss year for commercial auto through 2024, at $4.9 billion, with the liability combined ratio at 113 and the sector under-reserved by $4 billion to $5 billion.
Buyers feel the consequences at renewal rather than in the loss run. The Council of Insurance Agents and Brokers put commercial auto up 5.8 percent in the first quarter of 2026, the highest of any line and the fifty-ninth consecutive quarter of increases.
The practical consequence for anyone running a fleet risk assessment is specific. Two carriers with identical crash records can carry very different exposure, and the difference lies in documentation, driver files and whether dispatch pressure is visible in records a plaintiff will subpoena.
The Eight Exposure Domains a Fleet Risk Assessment Must Cover
Outcome data tells you the size of the problem but not where yours actually sits. Eight domains cover the exposures that generate real fleet losses, and fixing the list in advance stops teams quietly skipping whichever section is politically awkward.
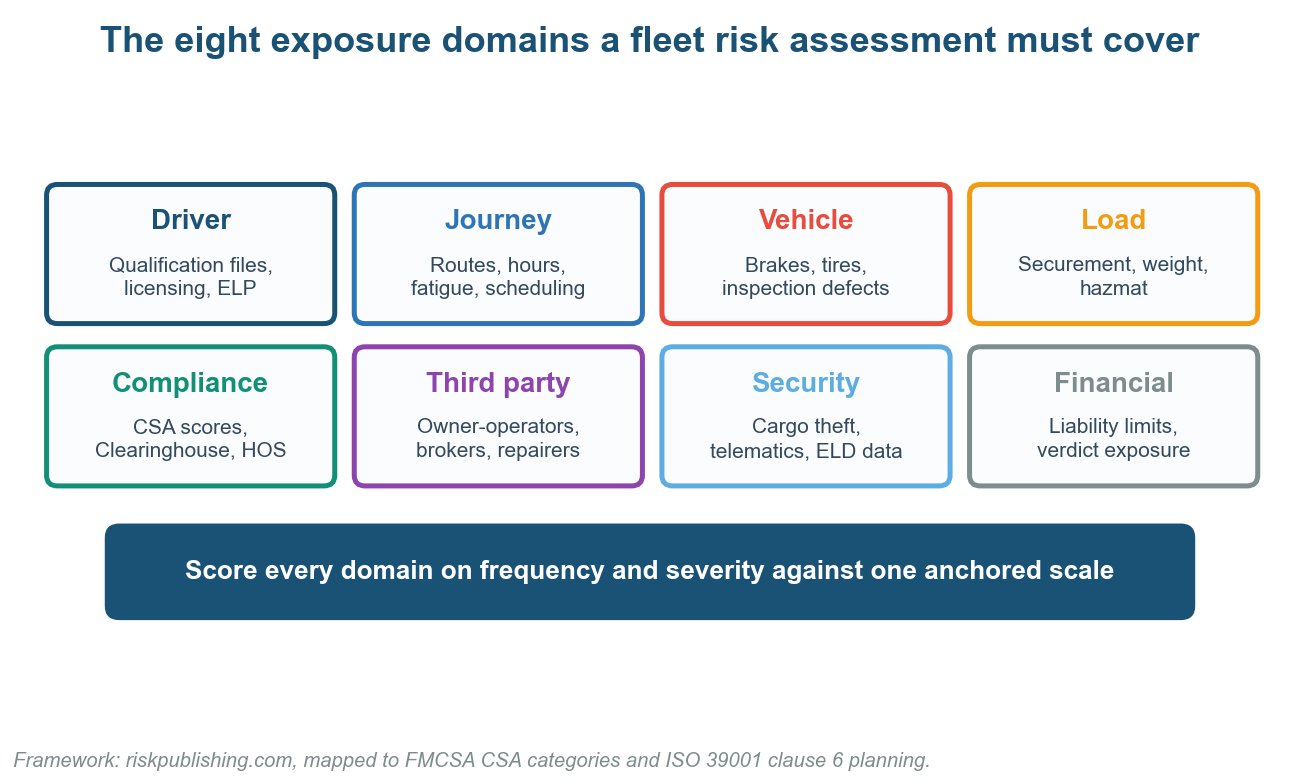
Eight domains mapped to FMCSA compliance categories and ISO 39001 planning requirements.
| Domain | The question that produces a number | Source of evidence |
|---|---|---|
| Driver | How many drivers hold a qualification file with a missing or expired document? | Driver qualification file audit |
| Journey | What share of dispatched runs cannot be completed inside hours-of-service limits? | Dispatch and ELD records |
| Vehicle | What is our out-of-service rate against the 18.1 percent national figure? | Roadside inspection history |
| Load | How many securement or weight violations did we record in the last 12 months? | Inspection and scale data |
| Compliance | Which CSA category sits closest to its intervention threshold? | FMCSA Safety Measurement System |
| Third party | Which owner-operator or repairer could we not replace within one week? | Contract and vendor register |
| Security | How many loads exceed our theft deductible, and who verifies the pickup? | Load manifests and claims |
| Financial | What is our exposure above the primary liability limit? | Policy schedule and reserves |
Every question in that table returns a figure or a name rather than a reassurance. A fleet risk assessment that asks whether driver fatigue is a concern will always be told it is being managed, which is precisely the answer that changes nothing.
Domain weighting should shift with the operation rather than staying fixed across every fleet risk assessment you run. A long-haul refrigerated carrier loads journey and security heavily, a municipal utility fleet loads vehicle condition and third party, and ISO 31000 context setting is where that judgement belongs.
How to Carry Out a Fleet Risk Assessment Step by Step
The eight domains give you coverage across the operation. Turning that coverage into an actual decision needs a repeatable cycle, and the reason most fleet risk assessment work never compounds is that it stops halfway through that cycle and never comes back to it.
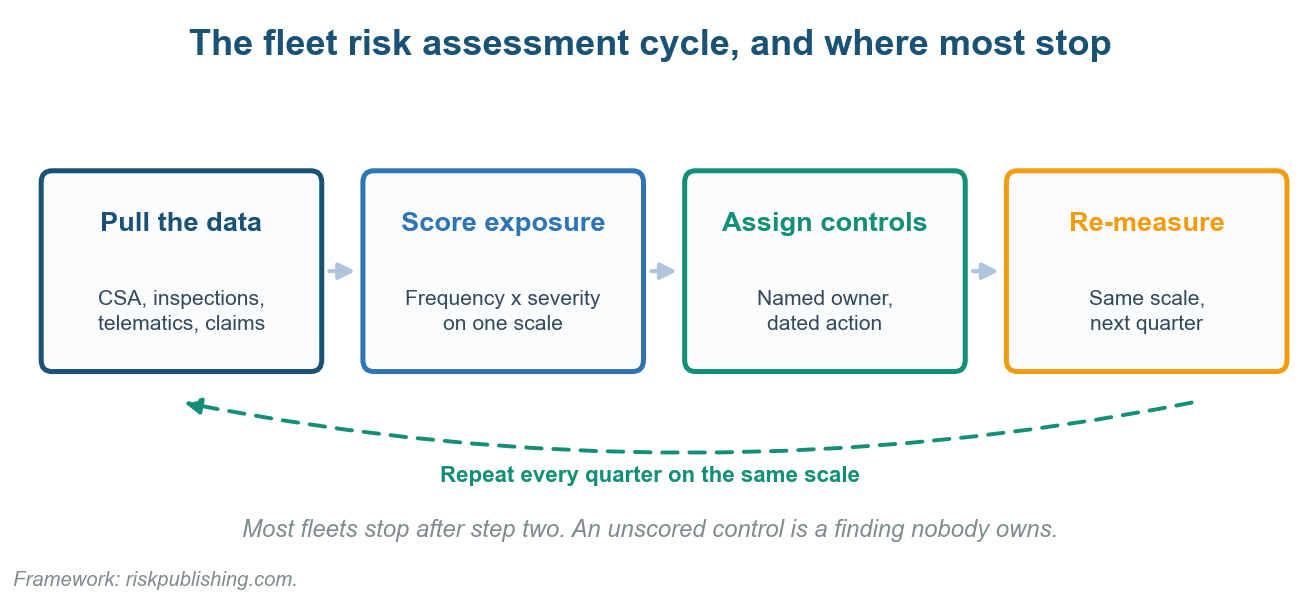
Four steps. Most fleets complete the first two and never close the loop on the last.
| Step | What you actually do | Evidence it was done properly |
|---|---|---|
| 1. Pull the data | Export CSA percentiles, 24 months of inspections, telematics events and claims | Every figure traces to a system, not a recollection |
| 2. Score exposure | Rate frequency and severity per domain on one anchored scale | Two assessors scoring separately land within one band |
| 3. Assign controls | Give each ranked finding an owner, a deadline and a budget line | No finding sits unassigned |
| 4. Re-measure | Re-score on the identical scale next quarter | Movement is attributable to a specific control |
Step three is where most fleet risk assessment exercises quietly die. A finding that never becomes a dated action with a named owner has cost the organization a workshop and changed nothing whatsoever about how its trucks are driven or maintained.
Our position on sequencing is firm and occasionally unpopular. Score before you shop, because a fleet risk assessment run after the telematics contract is signed becomes a justification exercise, and the risk management process sets out why that ordering matters so much in practice.
Scoring and Ranking Fleet Risk Assessment Findings
Scoring is where fleet risk assessment credibility is won or lost with a finance director. A bare one-to-five scale means something quite different to the maintenance supervisor than it does to the chief financial officer, so the bands need anchoring in money and frequency.
| Band | Frequency anchor | Severity anchor | Required response |
|---|---|---|---|
| Critical | Expected within 12 months | Above primary liability limit | Board visibility, funded this quarter |
| High | Expected within 24 months | $250,000 to primary limit | Named owner, funded plan, quarterly review |
| Medium | Possible within 24 months | $25,000 to $250,000 | Tracked action, reviewed half-yearly |
| Low | Unlikely within 24 months | Below $25,000 | Accept and monitor, no action funded |
Use the same anchors your insurance submission already uses. When the fleet risk assessment and the renewal submission disagree about what a serious loss actually looks like, underwriters notice immediately, and our risk matrix template settles that arithmetic before the first interview takes place.
What Roadside Data Tells Your Fleet Risk Assessment About Vehicle Condition
Vehicle condition is easier to score than most domains because the enforcement community publishes the benchmark for you. Roadside inspection results give a fleet risk assessment an external yardstick that no internal maintenance report can match for credibility with an underwriter.
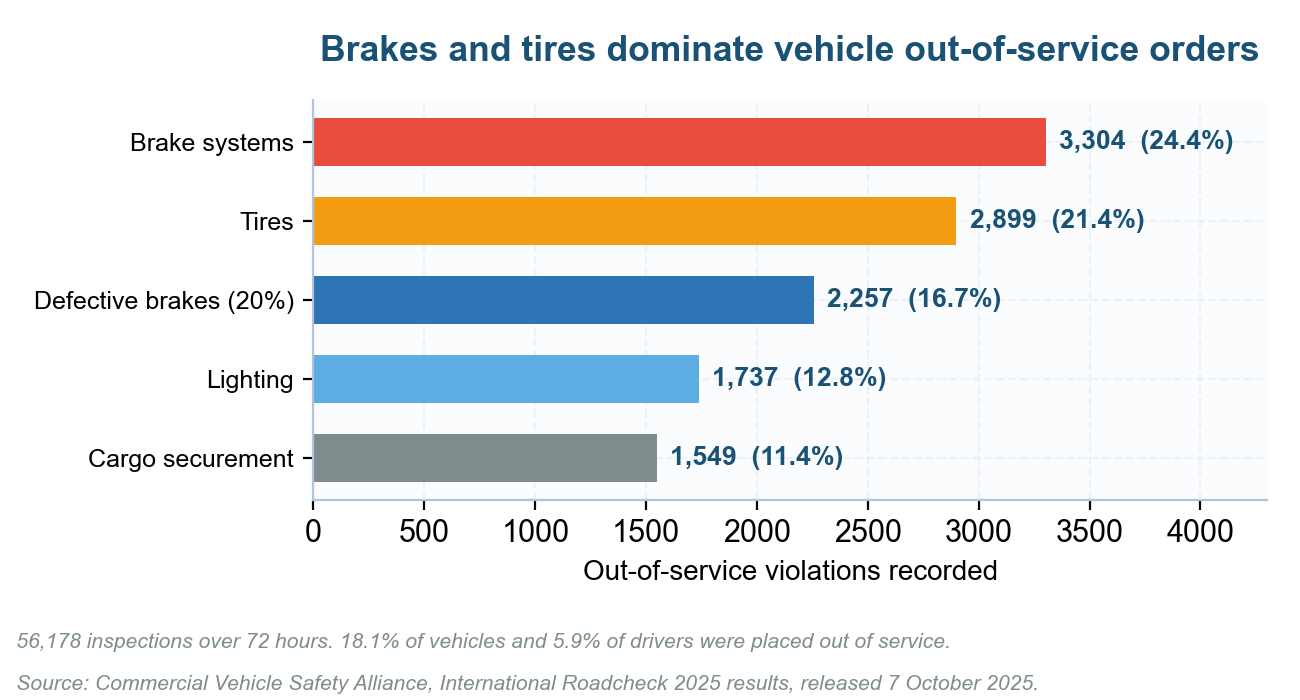
CVSA International Roadcheck 2025. Brake-related defects account for 41.1 percent of vehicle out-of-service violations.
The Commercial Vehicle Safety Alliance inspected 56,178 vehicles over 72 hours in May 2025, placing 18.1 percent of vehicles and 5.9 percent of drivers out of service. Brake systems alone accounted for 3,304 separate violations across that single 72-hour window.
Two comparisons belong in every fleet risk assessment as a direct result. Your own out-of-service rate measured against 18.1 percent, and your brake and tire defect share measured against the 41.1 percent and 21.4 percent national pattern those inspections recorded.
Hours-of-service violations led driver out-of-service orders at 32.4 percent, which is a scheduling finding rather than a discipline one. Fleets that treat it as the latter keep re-training people who are simply being dispatched on runs that cannot be completed legally.
What the Evidence Really Says About Telematics in a Fleet Risk Assessment
Telematics is where fleet risk assessment writing is least reliable, including in the earlier version of this article we are replacing. The headline numbers in wide circulation do not measure what most readers reasonably assume they measure, and the gap is a wide one.
The widely quoted 52 percent improvement comes from a Virginia Tech Transportation Institute study of roughly 100 tractor-trailers across two fleets over seventeen weeks. It measured safety-critical events per 10,000 miles, which is not the same thing as crashes at all.
The mechanism finding matters far more than the headline for anyone scoring controls. VTTI’s synthesis for the AAA Foundation concluded that in-cab feedback lights alone, or coaching sessions that did not review the video, were insufficient to significantly reduce events.
A controlled NIOSH evaluation across 315 vehicles and 625 drivers reached the same conclusion with sharper numbers. Coaching plus lights cut risky events materially, while lights alone returned an odds ratio of 0.86 that was not statistically significant against the control group.
| Claim you will hear | What was actually measured | How to score it |
|---|---|---|
| Telematics cuts crashes by half | Safety-critical events per 10,000 miles, two fleets, 17 weeks | Treat as an event proxy, not a crash reduction |
| Cameras prevent 60 to 80 percent of crashes | Vendor self-reported, not peer reviewed | Exclude from the assessment entirely |
| ELDs improved safety after the mandate | 11.7 percent lower crash rate among voluntary adopters | Discount heavily for selection effects |
| Hardware alone improves behaviour | No significant effect without video review and coaching | Score the coaching programme, not the device |
The honest position is narrower than the marketing and considerably more useful at renewal. Buy the hardware if you will fund the supervisor time to review footage and coach drivers, then score that coaching programme in your fleet risk assessment rather than the subscription.
Fatigue Is the Exposure Your Fleet Risk Assessment Most Likely Understates
Official fatigue statistics are known by their own publisher to be low. NHTSA attributed 644 deaths to drowsy driving in 2024, about 1.6 percent of traffic fatalities, while cautioning openly that a precise national count is not currently possible to produce.
Naturalistic research puts the real figure an order of magnitude higher. The AAA Foundation, using continuous in-vehicle video rather than police coding, estimated that 17.6 percent of fatal crashes involved a drowsy driver, roughly eleven times the federally recorded share.
Score fatigue against the naturalistic estimate rather than the federal one. A fleet risk assessment that ranks fatigue low because it accounts for 1.6 percent of deaths has quietly imported a known measurement artefact straight into its own funding priorities.
Cargo Theft and Cyber Exposure in a Modern Fleet Risk Assessment
Security used to sit near the bottom of the fleet risk assessment agenda, below maintenance and driver behaviour. The loss numbers no longer support that ranking, and the attack method itself has changed shape almost completely over the past three years.
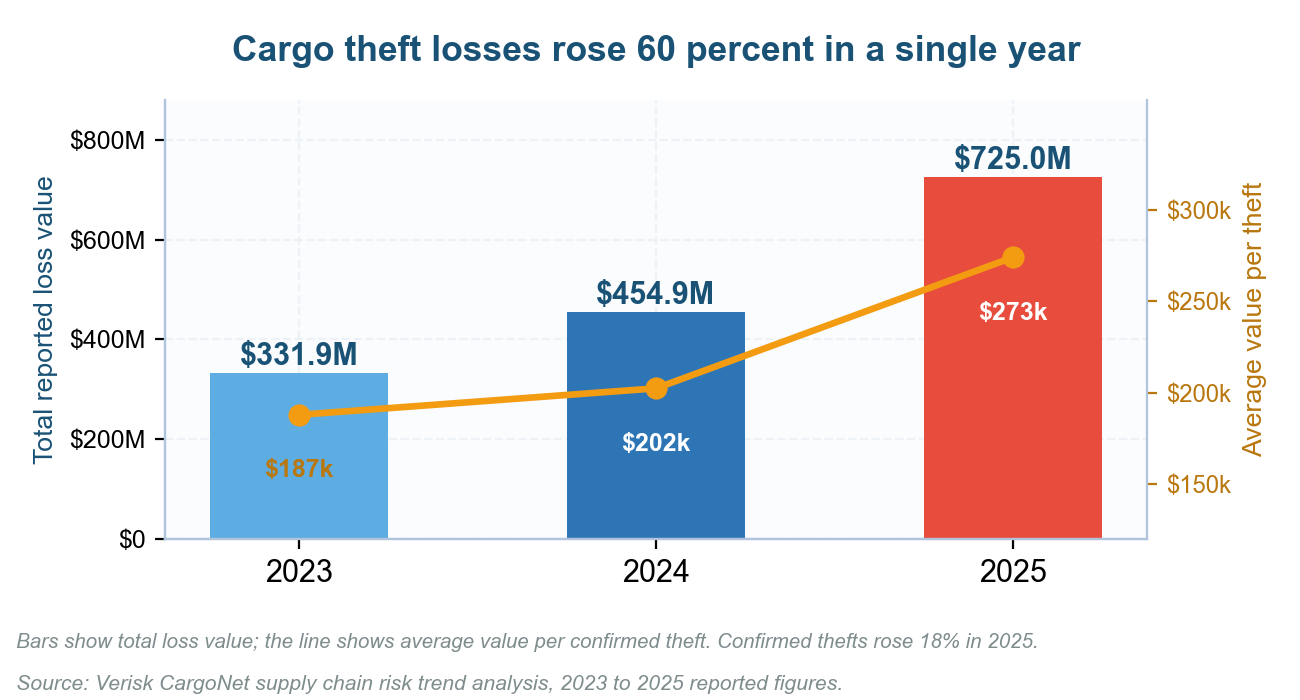
Verisk CargoNet reported figures. Confirmed thefts rose 18 percent in 2025 while total loss value rose 60 percent.
Verisk CargoNet recorded 2,646 confirmed cargo thefts in 2025, up 18 percent year on year, with losses approaching $725 million and an average of $273,990 per theft. California alone accounted for 1,218 of those recorded incidents, more than any other state.
The growth is in deception rather than in force, which changes where controls belong. Fraudulent pickups now account for around a tenth of recorded events, so exposure sits in carrier vetting and dispatch verification rather than in yard fencing and padlocks.
Federal law enforcement made the connection explicit in 2026. The FBI’s public service announcement on cyber-enabled cargo theft describes spoofed emails, fake load-board listings and compromised carrier accounts being used to double-broker freight away from the carrier rightfully assigned to haul it.
Vehicle systems themselves now fall inside the fleet risk assessment boundary. Researchers demonstrated a self-propagating worm across electronic logging devices at VehicleSec 2024, and CISA has published an advisory on trailer power line communication vulnerabilities scoring 9.3 on the common vulnerability scoring scale.
Treat these as one domain rather than two separate ones. A stolen load and a compromised load-board account produce an identical claim, and our work on supply chain risk heat mapping and supplier performance covers the counterparty half of the problem.
The Federal Rules a Fleet Risk Assessment Must Test Against
Compliance exposure changed materially across 2025 and 2026, faster than most fleet risk assessment templates were updated to match. Several fleet risk assessment checklists still in wide circulation now test against rules that no longer say what they said as recently as 2024.
| Requirement | What changed and when | What the assessment must verify |
|---|---|---|
| English language proficiency | Out-of-service enforcement began 25 June 2025; guidance superseded 16 April 2026 | Every driver can complete the two-step roadside assessment |
| Non-domiciled CDLs | Final rule effective 16 March 2026, tightening eligibility and validity | No driver holds a credential a state should have downgraded |
| Drug and alcohol Clearinghouse | State downgrade duty in force since 18 November 2024 | Annual queries run and prohibited drivers removed from dispatch |
| Hours of service | Limits unchanged; sleeper-berth split pilot proposed 17 September 2025 | Dispatch plans are achievable inside the 11 and 14 hour limits |
| ELD documentation | In-cab operator’s manual requirement rescinded, effective 22 July 2026 | Policies do not still mandate a withdrawn document |
| Employer duty of care | OSH Act general duty clause, unchanged since 1971 | Written policies on seat belts, distraction and maintenance exist |
Driver credential rules now carry consequences at state level as well as carrier level. FMCSA moved to withhold roughly $158 million from California over licence issuance in January 2026, following the executive order behind the enforcement push and the related out-of-service criteria change.
Two of these rules deserve a direct read rather than somebody’s summary. The non-domiciled CDL final rule governs whose licence is actually valid, and the Clearinghouse rule governs who may legally be dispatched on any given day. Between them they decide your driver domain score.
How a Fleet Risk Assessment Connects to CSA Scores
FMCSA’s Safety Measurement System ranks carriers across seven categories including unsafe driving, hours-of-service compliance, vehicle maintenance, controlled substances and driver fitness. Two of those seven categories are not publicly visible, which limits what competitors and brokers can infer about your operation.
Treat those percentiles as the outside world’s fleet risk assessment of your operation. Brokers, shippers and plaintiff attorneys all read them, and a category drifting toward its intervention threshold predicts an audit long before it predicts an actual crash on the road.
Verify the underlying obligations directly rather than through a vendor summary. FMCSA publishes the hours-of-service limits and the Clearinghouse requirements in full, and both pages change considerably more often than the internal policy manuals quoting them, which is exactly how fleets fall behind.
Using ISO 39001 to Give a Fleet Risk Assessment a Recognised Structure
Most fleets invent their assessment structure from scratch, then defend it under cross-examination. They do not need to, because a published international standard already specifies one and almost nobody in the sector currently uses it, which is a genuine competitive gap.
ISO 39001 sets out road traffic safety management system requirements in full. It was reviewed and confirmed as current in 2023, gained a climate-action amendment during 2024, and a revision is now in development at committee level, so the structure is settled without being frozen.
| ISO 39001 requirement | What it forces a fleet risk assessment to produce |
|---|---|
| Determine the organizational context | A written scope: which vehicles, which drivers, which jurisdictions |
| Identify road traffic safety performance factors | Exposure, risk and final-outcome measures, not just crash counts |
| Set measurable objectives | Targets tied to those factors, with dates and owners |
| Plan actions to address risks | Ranked, funded controls rather than a list of concerns |
| Evaluate and improve | Re-measurement on the same basis, feeding management review |
The value here is defensive every bit as much as operational. When a fleet risk assessment maps to a named international standard, its structure stops being a matter of personal opinion in a deposition, and our ISO 31000 explainer covers the parent framework it inherits from.
Three Beliefs That Distort Fleet Risk Assessment Priorities
Some of the most confident assumptions in fleet safety planning are simply out of date. Each of the three below appears regularly in the assessments we review, and each one points real money at something that is not going to happen.
| The belief | What is actually true | What it means for the assessment |
|---|---|---|
| Speed limiters are coming, so budget for retrofit | FMCSA withdrew the rulemaking on 24 July 2025 | Reallocate that budget to brake and tire programmes |
| Heavy trucks must fit automatic emergency braking | No final rule exists; the 2023 proposal is unfinished | Treat heavy-vehicle AEB as an economic choice, not compliance |
| CSA has been reformed, so scores mean something new | Safety fitness reform is still pre-proposal | The three-tier rating system still governs; score against it |
The speed limiter case is genuinely instructive for assessors. FMCSA formally withdrew the proposal, citing advancing crash-avoidance technology and an inability to demonstrate a net crash reduction, which is a rare and useful admission for a federal regulator to put in writing.
The braking mandate is the one most often misstated in fleet risk assessment documents. The 2023 heavy-vehicle proposal never became a rule, and the only binding requirement is FMVSS No. 127, covering vehicles at or below 10,000 pounds from September 2029.
Carrier ratings are the third and most consequential trap. The safety fitness rulemaking has not progressed beyond an advance notice, so any fleet risk assessment assuming a new single unfit determination is scoring against a system that does not yet exist.
Red Flags in a Completed Fleet Risk Assessment
A finished fleet risk assessment tells you about the operation and, quite separately, about how safe people felt saying what they already knew. The patterns below usually mean the second reading is the more urgent of the two, and the harder one to fix.
| What you see in the document | What it usually means |
|---|---|
| Nothing scored critical or high | Scoring high carries consequences somebody has learned to avoid |
| Every control is training | The assessment could not reach scheduling, maintenance or procurement decisions |
| No dollar figures anywhere | Finance was never in the room, so the output cannot compete for budget |
| Driver domain scored lowest | Qualification files were assumed compliant rather than sampled |
| Identical scores to last year | The document was updated rather than re-run |
| Telematics alerts counted as controls | An alert nobody acts on is a data feed, not a control |
The last row is the one we encounter most often by a wide margin. Fleets buy monitoring, generate many thousands of harsh-braking events, then count the technology itself as mitigation without anybody ever reviewing whether driver behaviour actually changed out on the road.
The first row runs it close in our experience. A register where nothing at all reaches the top band is not a low-risk fleet, and the honest reading is that the fleet risk assessment measured the reporting culture rather than the exposure.
Common Fleet Risk Assessment Questions Practitioners Ask
How Often Should a Fleet Risk Assessment Be Carried Out?
Run the full fleet risk assessment annually, re-score quarterly on exactly the same scale, and re-run it immediately after any material change to routes, fleet composition or a major supplier. An assessment refreshed only at insurance renewal is a snapshot that ages very badly.
Who Should Be Involved in a Fleet Risk Assessment?
Include the safety lead, the maintenance manager, a dispatcher, a working driver and someone from finance who owns the insurance budget. That finance seat is the one most often left empty, and its absence explains why so many assessments never convert into funded controls.
What Is the Difference Between a Fleet Risk Assessment and a Safety Audit?
An audit tests compliance against a fixed standard and returns pass or fail findings against it. A fleet risk assessment estimates future loss and then ranks it, so it can legitimately conclude that a fully compliant operation still carries unacceptable exposure.
Does a Small Fleet Need a Formal Fleet Risk Assessment?
Yes, and arguably rather more urgently than a large one does. A single severe claim can exceed a small operator’s entire asset base where a major carrier absorbs it, which is why severity-weighted scoring matters most to the fleets least able to fund it.
What Data Sources Should a Fleet Risk Assessment Draw On?
Use CSA percentiles, 24 months of roadside inspection results, telematics event data, driver qualification file samples, claims history and dispatch records. Anything a driver or a manager merely recalls belongs in the interview notes, and never in the score itself.
How Does a Fleet Risk Assessment Support an Insurance Renewal?
It gives underwriters documented evidence rather than assertion. With ATRI recording marginal operating costs at $2.336 per mile during 2025, a documented and repeatedly re-measured fleet risk assessment is one of the few levers a carrier still genuinely controls at renewal.
What Does OSHA Require in a Fleet Risk Assessment?
There is no OSHA standard governing the operation of a vehicle on public roads. The duty flows instead from the general duty clause, supported by OSHA’s motor vehicle safety guidance and the crash recordkeeping rules that follow any crash involving an employee at work.
Three Shifts That Will Rewrite the Fleet Risk Assessment Playbook
Fleet risk assessment practice is being pulled in three separate directions simultaneously over the next few years. Fleets that anticipate them will spend the coming renewal cycles arguing from documented evidence rather than from hope and one clean loss run.
Severity pricing will keep outrunning frequency improvement for the foreseeable future. Swiss Re measured social inflation adding 57 percent to US liability claims over a decade, so a fleet risk assessment now needs a defensibility measure sitting alongside the safety one.
Driver credential integrity becomes a live operational risk rather than an administrative chore. With states facing federal funding penalties over licence issuance, the qualification file moves from a filing cabinet to a domain capable of grounding trucks within a single shift.
Deregulation cuts both ways for anyone running a fleet risk assessment. The rescinded in-cab manual requirement removes a paperwork obligation, but every withdrawn federal rule shifts the argument about reasonable care back onto the operator and its own documented judgement.
The Fleet Risk Assessment Cheat Sheet
Score severity and not just frequency, because severity is what the market actually prices. Anchor every band in dollars and dates, cover all eight exposure domains, and then re-measure quarterly on a scale you did not quietly change between rounds.
Start narrow this week rather than planning a perfect programme. Pull your out-of-service rate and compare it to 18.1 percent, sample ten driver qualification files, and check whether last year’s fleet risk assessment produced a single funded action anybody can name.
We build and run fleet risk assessment cycles for operators, including the awkward conversations about dispatch pressure that nobody volunteers for. Explore our advisory services or get in touch to discuss a review, and our risk assessment templates cover the documentation side.
Teams working alone should route the output somewhere durable rather than into a slide deck. Feed findings into a KPI dashboard, track them using indicators from the KRI directory, and borrow structure from the aviation and construction equivalents.
Then connect the fleet risk assessment to everything sitting downstream of it in the programme. Our published work on transportation risk assessment, risk mitigation and the risk management lifecycle all cover what has to happen after the fleet risk assessment itself closes.
Severe loss scenarios need a continuity answer as well as a prevention one, because some exposures cannot be designed out. Pair the fleet risk assessment with a business continuity management program, a disaster recovery plan and a genuinely working incident management system.
Several further resources close the loop for practitioners building this capability internally. Our guides to business resilience, warehouse OSHA recordkeeping risk, concentration risk, risk management certifications and the project risk assessment questionnaire all reinforce the same discipline.

Chris Ekai is a Risk Management expert with over 10 years of experience in the field. He has a Master’s(MSc) degree in Risk Management from University of Portsmouth and is a CPA and Finance professional. He currently works as a Content Manager at Risk Publishing, writing about Enterprise Risk Management, Business Continuity Management and Project Management.