California’s bullet train is the most expensive live lesson in managing complex projects the United States currently runs. When the High-Speed Rail Authority released its draft 2026 business plan, chief executive Ian Choudri had to defend two prices for one railroad: $126.2 billion with every proposed saving applied, or $231.3 billion without them.
Voters approved $9.95 billion in bonds for the system in 2008, when the full build was pitched at roughly $45 billion. State Senator Tony Strickland gave the drift its scale at a Senate Transportation Committee hearing: the high estimate now exceeds California’s entire state budget from a decade ago.
| Managing Complex Projects: The Executive Summary |
| Complex projects differ from complicated ones: cause and effect appear only in hindsight, so the plan must be built to learn (Cynefin, ISO 21502). |
| PMI’s 2026 Pulse: teams highly effective at navigating complexity succeed 88% of the time versus 14%, and 31% of complex projects miss their full benefits. |
| California High-Speed Rail shows the price of skipping the diagnosis: pitched near $45B in 2008, now $126.2B to $231.3B in the draft 2026 plan. |
| Structure beats heroics: modular scope, rolling-wave planning, and reference-class estimates are the moves that beat Flyvbjerg’s iron law (0.5% deliver everything). |
| Governance is measurable: written decision rights, independent assurance, and escalation triggers prevent the 597-change-order pattern. |
| Run risk management as a loop: short live registers, a KRI on every top risk, and complexity re-scored at every stage gate. |
Complexity, not incompetence, is the pattern behind numbers like these, and it punishes every sector the same way. This guide shows how to diagnose a complex project before planning it, structure the work so surprises stay affordable, govern decision rights, and run risk management that bends the outcome curve.
What Makes a Complex Project Different From a Complicated One
Start with the distinction that saves the most money, because it decides your whole delivery approach. In the Cynefin framework David Snowden and Mary Boone published in Harvard Business Review in 2007, complicated problems yield to expertise and analysis, while complex problems reveal cause and effect only in hindsight.
A complicated project, such as a routine refinery turnaround, rewards exhaustive up-front planning. A complex project changes shape as stakeholders react and interfaces multiply, so its plan must be built to learn. ISO 21502, the international standard for project management guidance, makes tailoring the delivery approach an explicit requirement.
| Dimension | Complicated project | Complex project |
| Cause and effect | Knowable in advance through analysis | Visible only after you act |
| Value of detailed plans | High; the plan is the asset | Decays fast; learning is the asset |
| Expertise | The right specialists can solve it | Specialists disagree; synthesis is needed |
| Change behavior | Deviations are errors to correct | Deviations are information to use |
| Fit-for-purpose method | Waterfall and critical path | Iterative, modular, rolling wave |
PMI’s 2026 Pulse of the Profession research prices the difference. Teams rated highly effective at navigating complexity delivered an 88 percent project success rate, against 14 percent for teams rated slightly effective or ineffective, and 31 percent of complex projects still failed to deliver their full intended benefits.
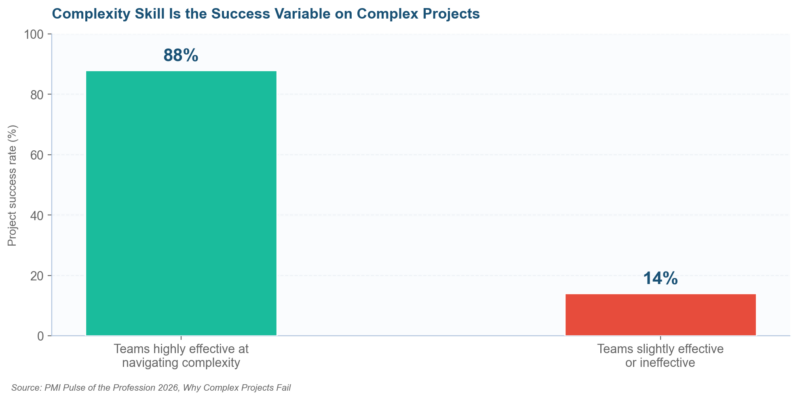
Figure 1. PMI’s 2026 Pulse data: skill at navigating complexity separates an 88 percent success rate from 14 percent.
That spread is the strongest argument we know for treating complexity as a risk class of its own. The distinction also maps cleanly onto how strategic risks differ from operational risks, which is why the two guides pair well: both force you to name the kind of problem before funding it.
How to Assess a Complex Project Before You Plan It
Because complexity decides the method, assessment must come before scheduling, and before the baseline gets signed. Peer-reviewed work in the journal Systems analyzing project complexity dimensions found they materially predict success, which means a thirty-minute diagnostic carries genuine forecasting power for any complex project portfolio.
Score the project on five dimensions: structural scale, technical novelty, requirement stability, stakeholder alignment, and pace. Use a one-to-five scale anchored in observable facts, the same discipline that powers a step by step risk assessment. Anything scoring four or higher on two dimensions belongs in the complex category.
| Complexity dimension | Diagnostic question | High-score signal |
| Structural | How many teams, vendors, and interfaces? | More than five parties own critical-path work |
| Technical | Has anyone built this before? | First-of-a-kind engineering or unproven technology |
| Uncertainty | How stable are the requirements? | Sponsors revise scope quarterly or faster |
| Stakeholder | Do decision-makers agree on success? | Public opposition or split governance |
| Pace | How hard is the deadline? | Regulatory or market date that cannot move |
Run the scorecard twice, once with the delivery team and once with the sponsor, and treat every gap between the two as an early warning. The same double-scoring habit powers our approaches and tools for risk identification, and it routinely surfaces the stakeholder disagreements that later become change orders.
Repeat the assessment at every stage gate as well, since complexity moves during delivery. A project that started complicated can turn complex when a vendor fails or a regulation lands, which is the same logic behind how often risk assessments should be conducted.
Structuring Complex Projects: Modularity and Rolling-Wave Planning
Assessment done, structure comes next, and the evidence points one direction. Oxford professor Bent Flyvbjerg’s database of more than 16,000 projects shows only 0.5 percent finish on time, on budget, and with the promised benefits, the record he calls the iron law of projects in How Big Things Get Done.
The projects that beat the iron law share one design property: modularity. Solar farms, wind portfolios, and factory-built infrastructure repeat a small unit many times, converting one giant bet into a learning curve, an argument Harvard Business Review laid out in Make Megaprojects More Modular.
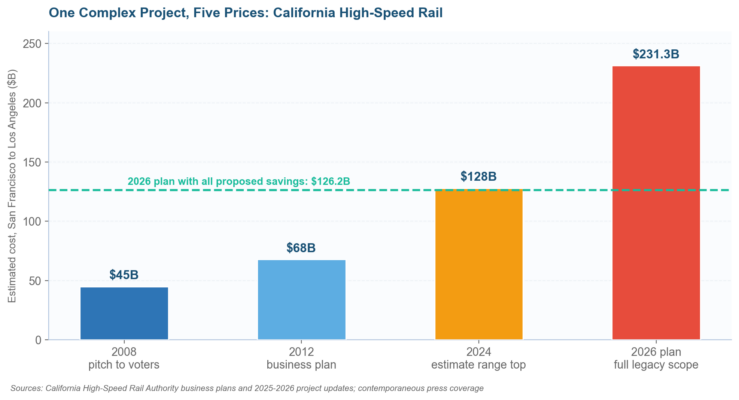
Figure 2. California High-Speed Rail’s published estimates, from the $45 billion pitch of 2008 to the $231.3 billion full-scope figure in the draft 2026 plan.
California’s rail program illustrates both halves of the lesson. The monolithic 500-mile scope produced the runaway estimates in Figure 2, while the authority’s current 171-mile Merced to Bakersfield segment, priced at $34.76 billion with a 2033 target, behaves like a module: financeable, testable, and survivable if plans change.
| Structuring move | What it does | Where it pays off |
| Modularize the scope | Repeats a buildable unit instead of one big bet | Infrastructure, rollouts, migrations |
| Rolling-wave planning | Details 4-8 weeks ahead; keeps the rest in outline | Fast-moving requirements |
| Decouple interfaces | Puts buffers and contracts at every hand-off | Multi-vendor programs |
| Small delivery batches | Ships usable value early and often | IT and product work |
| Reference-class estimates | Prices work from outcomes of similar projects | Any first-of-a-kind scope |
Anchor the schedule itself in the GAO Schedule Assessment Guide and its ten scheduling disciplines, which federal auditors use to test whether a plan can absorb change.
Pair it with reference-class estimating from the GAO Cost Estimating and Assessment Guide, and your baseline starts from evidence instead of optimism.
Governing Complex Projects: Decision Rights and Change Control
Structure sets up the work; governance decides whether it survives contact with stakeholders. By November 2025 California’s program had absorbed 597 change orders worth about $2.3 billion, Taxpayers for Common Sense reported, and in February 2025 US Transportation Secretary Sean Duffy ordered a federal compliance review of the project’s grants.
The authority’s own Office of the Inspector General reported that the draft 2026 plan omitted information required by law. That is a governance finding, and it echoes what we see in corporate programs: reporting drifts toward advocacy whenever the same office both delivers the project and grades its progress.
| Governance element | Question it must answer | Failure mode when missing |
| Decision rights | Who can change scope, and up to what amount? | Hundreds of change orders, no single owner |
| Independent assurance | Who verifies progress claims? | Reporting drifts toward advocacy |
| Stage gates | What evidence releases the next funding tranche? | Sunk-cost escalation |
| Stakeholder map | Whose consent can stop the work? | Late-arriving opposition and vetoes |
| Escalation triggers | What variance forces a re-plan? | Quiet erosion of the baseline |
Write the decision rights down before mobilization: who may commit money, who may accept risk, and which variances trigger escalation. ISO 21502 places that accountability with the project sponsor, and boards increasingly test it through the lens of convergence of risk oversight with strategic planning.
Risk Management Inside Complex Projects
Governance gives you the decision table; risk management keeps the right items on it. ISO 31000 defines the cycle, but complex projects change the emphasis: identification never ends, assessments age in weeks, and the five steps of the risk management process must run as a continuous loop.
| Complexity dimension | Dominant risk pattern | Response that works |
| Structural | Interface failures between parties | Contracted hand-offs, integration buffers |
| Technical | Estimates anchored on hope | Reference-class data and early prototypes |
| Uncertainty | Scope churn eroding the baseline | Rolling wave, pre-authorized re-planning |
| Stakeholder | Late vetoes and change orders | Early consent mapping, written decision rights |
| Pace | Corner-cutting under deadline pressure | Buffer reporting and quality gates |
Build the register around live exposure, and keep it small enough to read: our key elements of a risk register guide argues for depth on the top ten over coverage of two hundred. Wire each top risk to a leading indicator using key risk indicators examples so movement shows up before the milestone slips.
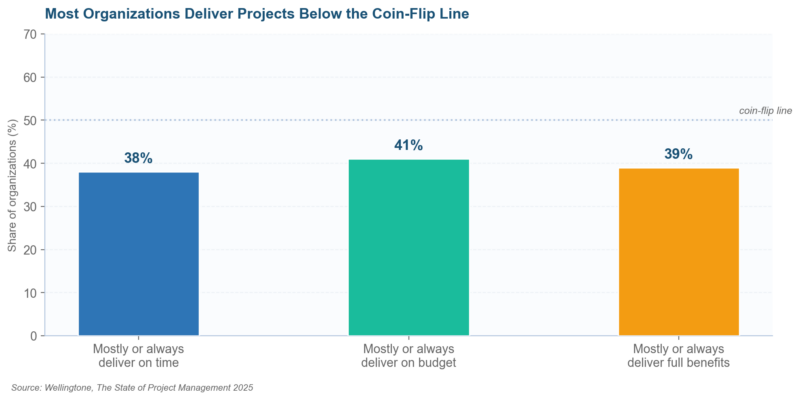
Figure 3. Wellingtone’s 2025 State of Project Management data: fewer than half of organizations mostly deliver on time, on budget, or on benefits.
Wellingtone’s 2025 survey shows why the loop matters: only 38 percent of organizations mostly deliver on time, 41 percent on budget, and 39 percent with full benefits. Quantify the biggest exposures with qualitative and quantitative risk assessment methods, then rehearse the ugly ones through scenario based risk assessment.
The Skills That Keep Complex Projects Moving
Method carries a complex project only as far as the people running it. PMI’s 2025 Pulse of the Profession, drawn from 2,841 professionals, found just 18 percent demonstrate high business acumen, yet their projects met business goals 83 percent of the time against 78 percent for everyone else, with failure rates of 8 versus 11 percent.
| Skill | What it looks like on a complex project | How to grow it |
| Systems thinking | Sees coupling between workstreams before it bites | Pre-mortems and interface reviews |
| Business acumen | Ties every trade-off to benefits and cash | Rotations through P&L roles |
| Delegation | Matches tasks to proven skill sets, then steps back | Skills matrix, deputies at each interface |
| Sense-making communication | Converts ambiguity into decisions stakeholders accept | Weekly narrative reporting |
| Adaptability | Re-plans without treating change as failure | Pre-authorized re-planning triggers |
Delegate against a skills matrix, and hold people accountable for interfaces as much as for tasks, because complex projects fail between teams more often than inside them. Track team load the way a portfolio tracks exposure, on a key risk indicators dashboard the sponsor actually reads.
PMI’s 2026 research adds the systems-thinking evidence: standard playbooks alone were not enough on complex projects, and the teams that outperformed were trained to read feedback loops. Fold that capability into your enterprise risk management framework so complexity skill becomes an organizational asset, and audit it like one.
Common Complex Project Questions Practitioners Ask
What makes a project a complex project?
Interdependence plus uncertainty. A complex project has enough moving parts that cause and effect become clear only in hindsight, so detailed long-range plans decay quickly. Score structure, novelty, requirement stability, stakeholder alignment, and pace; high marks on two or more dimensions put you in complex territory.
How do you start managing a complex project?
Diagnose before you plan, every time. Run the five-dimension scorecard with the sponsor and the delivery team separately, reconcile the gaps, and let the score choose the method: modular and rolling wave where complexity is high, classic critical path where the work is genuinely predictable.
Which methodology works best for complex projects?
No single one wins, and PMI’s 2026 Pulse found standard playbooks alone do not rescue complex projects. Hybrids dominate in practice: iterative delivery inside stage-gated funding, drawing on the Scrum Guide for the iterative half and ISO 21502 for the governance shell around it.
How is risk management different on a complex project?
Cadence and emphasis change most. Assessments age in weeks, so identification runs continuously, registers stay short and live, and every top risk carries a leading indicator. Interface risk between teams and vendors, which barely registers on simple work, usually becomes the dominant exposure class.
What tools support complex project management?
Primavera P6, Microsoft Project, and portfolio platforms handle resource-loaded schedules, while Monte Carlo add-ins price the schedule risk. Tools amplify method rather than replace it, so fix decision rights and planning waves first, then automate whatever already works on your complex project portfolio.
When should a complex project be split into smaller projects?
As soon as a module can deliver value on its own. California’s rail authority now leads with a 171-mile segment priced at $34.76 billion instead of financing all 500 miles at once. Splitting converts a single existential bet into a sequence of survivable ones.
What skills matter most for complex project leaders?
Systems thinking and business acumen top the current evidence. PMI’s 2025 data ties high acumen to an 83 percent goal-achievement rate, and its 2026 research credits systems thinking for most of the complexity premium. Both are trainable, which makes them budget items as much as hiring criteria.
Seven Traps That Derail Complex Projects
Most complex project failures we review trace back to a handful of repeating traps, and several usually operate at once. The remedies travel well across sectors because the causes are structural, the same reason operational risk management disciplines transfer so cleanly between industries.
| Pitfall | Root cause | Remedy |
| Planning complexity away | Treating a complex project as merely complicated | Re-run the scorecard at every gate |
| One monolithic scope | A single bet with no learning curve | Modularize; deliver value in segments |
| Optimism-anchored estimates | Inside view only | Reference-class data per GAO guidance |
| Diffuse decision rights | Nobody owns scope changes | Written authority limits and triggers |
| Advocacy reporting | The delivery office grades itself | Independent assurance line |
| Static risk registers | Assessed once, filed forever | Live registers wired to KRIs |
| Interface neglect | Teams optimized, hand-offs orphaned | Name an owner for every interface |
Where Complex Project Delivery Is Heading: 2026 to 2028
Put AI scenario simulation at the top of the 2026 watchlist. Portfolio platforms now generate thousands of schedule and resource scenarios in minutes, moving the leader’s job from building one plan to choosing among many, and PMI’s megaproject outlook expects that decision-support role to keep widening.
By 2028, expect complexity scoring to sit inside stage-gate templates the way cost contingency does today.
The 2026 Pulse finding that systems thinking beats standard playbooks is already redirecting training budgets, and certification bodies are following the money with complexity electives across their curricula.
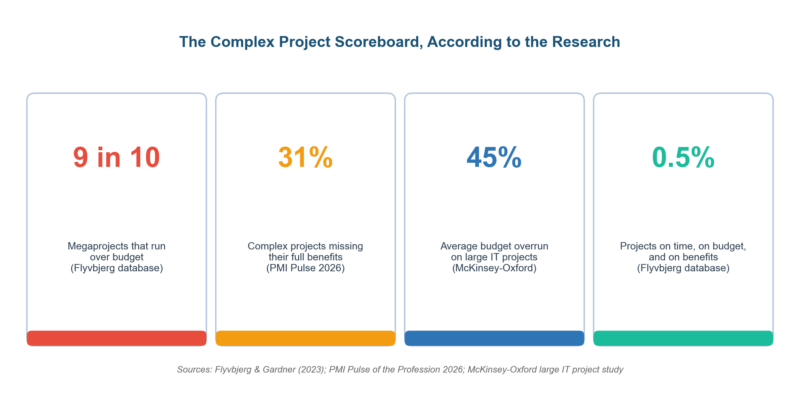
Figure 4. Four published numbers that frame any complex project business case, from the iron law to the complexity premium.
Regulatory scrutiny is the third shift. Washington’s February 2025 review of California’s grants previewed a world where funders audit complexity management itself, and we expect private capital to copy the playbook by asking sponsors to evidence an integrated risk management approach before releasing tranches.
Our position after years around troubled programs is plain: complexity is a property to be priced, and the teams that price it early buy their flexibility cheapest. Treat this guide’s scorecards and registers as risk management techniques subject to audit, and the iron law stops being your forecast.
Manage Complex Projects With Risk Publishing
Sponsors and PMO leads bring us the same two questions: how complex is this project really, and which controls pay for themselves first. Explore our services for the frameworks behind this guide, or get in touch to workshop your complexity scorecard against the evidence above.

Chris Ekai is a Risk Management expert with over 10 years of experience in the field. He has a Master’s(MSc) degree in Risk Management from University of Portsmouth and is a CPA and Finance professional. He currently works as a Content Manager at Risk Publishing, writing about Enterprise Risk Management, Business Continuity Management and Project Management.