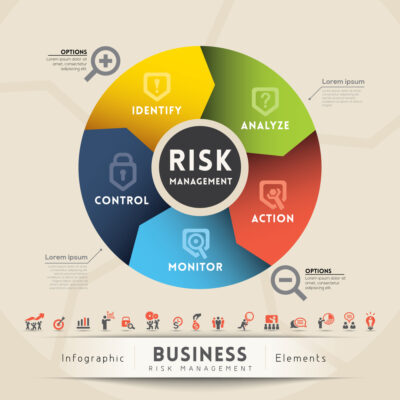
A key risk indicator (KRI) dashboard visually displays an organization’s key risk indicators. It provides a quick and easy way to track, monitor, and report on risks. Kris can identify trends, set thresholds, and trigger alerts. They are an important part of any risk management process and program.
There are many benefits to using a KRI dashboard. For one, they can help you save time. You no longer have to manually collect data from various sources and then enter it into a spreadsheet. The data is automatically fed into the dashboard, which can be customized to your specific needs.
Another benefit is that KRIs can help you identify risks you may not have been aware of. You can better understand where your organization is exposed to risk by tracking key indicators. This information can then be used to develop strategies to mitigate those risks.
Finally, KRIs can help you improve communication within your organization. Dashboards provide a centralized location for all risk-related information. This makes it easier for everyone to stay up-to-date on the latest risks and how they are managed.
Now that we’ve discussed some of the benefits of using a KRI dashboard let’s look at how to use one. The first step is to identify the key indicators you want to track. These will vary depending on the industry and organization. Some common indicators include safety incidents, financial losses, customer complaints, etc.
Once you’ve identified the indicators you want to track, setting up thresholds is next. Thresholds are used to trigger alerts when a risk reaches a certain level. For example, you may set an incident threshold of 10 incidents per month. If the number of incidents exceeds 10 in any given month, an alert will be triggered.
The final step is to monitor the dashboard regularly. This will allow you to identify any risks that exceed their thresholds quickly. You can then take appropriate action to mitigate those risks.
As a business owner, you constantly look for ways to improve your operations and increase profits. One way to achieve this is by monitoring key risk indicators (KRIs). A KRI dashboard can help you do that by providing an at-a-glance view of your organization’s performance in relation to specific KRIs.
In this blog post, we’ll explore the benefits of using a KRI dashboard and discuss some of the most important factors to consider when creating one. We’ll also provide tips on how to get the most out of your KRI dashboard. So if you’re ready to take your business to the next level, keep reading!

Key Risk Indicators You Should Be Tracking on Your Dashboard
There are many types of KRIs, but some common examples include customer churn rate, supplier delivery time, and employee turnover rate.
1. Customer Churn Rate
Your customer churn rate is the percentage of customers that stop doing business with you over a given period of time. This metric is important because it can help you identify areas where your business is losing customers and take steps to improve the situation.
A high customer churn rate can indicate several risks, such as poor customer service, high prices, or inadequate product quality. This risk exposure can lead to significant risks affecting the business objectives adversely.
2. Supplier Delivery Time
Your supplier delivery time is the average amount of time it takes for your suppliers to deliver goods or services to you. This metric is important because it can directly impact your ability to meet customer demand.
If your suppliers are consistently late in delivering goods or services, it will likely lead to stockouts and disruptions in your own operations. Supply challenges are one of the most significant risks that require periodic and regular reviews.
3. Employee Turnover Rate
Your employee turnover rate is the percentage of employees leaving your organization over a given period. This metric is important because it can help you identify potential problems with workplace conditions or company culture.
A high employee turnover rate can be very costly for businesses, so it’s important to monitor this metric closely and take steps to address any issues that may be causing employees to leave.
4. Safety Incident Rate
Your safety incident rate is the number of safety incidents that occur at your workplace per 100 employees over a given period of time. This metric is important because it can help you identify potential hazards in your workplace and take steps to mitigate them. Some organizations have no risk appetite for safety issues.
A high safety incident rate can lead to increased workers’ compensation costs, lost productivity, and damage to your company’s reputation.
5. Quality Incident Rate
Your quality incident rate is the number of products or services that are defective or do not meet customer expectations per 100 units produced over a given period of time. This metric is important because it can help you identify potential problems with your products or services and take steps to improve quality control.
A high-quality incident rate can lead to increased returns and refunds, damaged reputation, and lost customers. A thorough understanding of quality risks is important and leveraging technology can assist in identifying kris.
6 . Cybersecurity Breach Rate
Your cybersecurity breach rate is the number of successful cyber attacks on your systems per 100 computers over a given period of time. This metric is important because it can help you gauge the effectiveness of your cybersecurity measures and take steps to improve them if necessary .
A high cybersecurity breach rate can lead to the loss or theft of sensitive data, financial damage, and reputational damage. Setting thresholds for security breaches and frequency monitoring performance needs an internal acceptance capability.
Risk managers, compliance professionals, and external audit specialists understand the ways of managing risk for companies. Risk identification processes must have an iterative nature if they are dynamic.
The auditor must review risk assessment methods and modify risk responses and processes in rapidly changing circumstances. You and your employees must define key risk indicators to manage and prepare for future threats. It helps protect a company against different risks affecting its business plan.
A security plan safeguards organizations against operational, reputation, and other risks and requires periodic reviews. A senior executive can quickly report on a key risk during this review process.
All this can happen if a thorough knowledge of the risks allows proper detection, creates appropriate risk indicators and monitors performance with the Key Performance Indicators (KPI). This can be done by employing technology.
An integrated risk management dashboard is vital in understanding the risk landscape in an organization. In a presentation to the board, you will be able to present high KPIs and insights.

How can I identify key risk indicators for my business?
Assessment of team performance and making sure goals are reached are critical aspects. Whenever they view their dashboard each morning, their businesses’ leaders will see data demonstrating how things are going.
It includes KRI data. The KRIs fall beyond thresholds alerting the management of increased risks of occurrence — but the KRIs only work well in the form of this simple approach to developing the method.
Identify Relevant Risks
Before setting up a KRIs, it’s important to understand the business’s goals and identify any potential risks. Effective risk management involves identifying the largest risks – those with a high likelihood of occurring or that will not exist under company control. Identify key risks and develop key risk indicators kris for these risks.
Establish Your KRIs
Typically companies have Key performance indicators that can create KRIs. How do I find the answer? This will reduce time spent monitoring as well as providing necessary data. New kris can be derived from business strategy and the current state of the business environment.
Ensure the KPIs transferred to the KRI have an appropriate, measurable, and rational nature. Those KPIs are outdated or not currently applicable so should not be used.
Establish a solid process
Since the KI is developed within each department, a solid process is needed to establish the necessary documentation. These good practices help ensure everything goes smoothly. It’s possible to develop key risk indicators using a methodical approach. The risk management plan need to define kri and determine essential access to kris database.
Leading/Lagging KPIs vs. Probability/Impact KRIs
Leading and lagging Key Performance Indicators (KPIs) measure past performance, while Probability and Impact Key Risk Indicators (KRIs) assess potential future risks. Lagging KPIs often focus on financial data such as revenue and profitability. Leading kris are mostly used in the banking sector.
Leading KPIs, on the other hand, track certain behaviors or conditions that can predict future success or failure. Probability KRIs measure the likelihood of a risk occurring, while Impact KRIs gauge the potential effect on the business if that risk were to come to fruition.
It’s important to monitor performance of both types of indicators to have a complete picture of a company’s performance and potential vulnerabilities. Utilizing a combination of leading/lagging KPIs and probability/impact KRIs can enable a more comprehensive assessment and proactive approach to managing risk.

What are examples of key risk indicators?
The KRIs vary according to their type: they may focus on human resources, operational technology, or some aspects of the company’s activities.
Technological KRIs
A failure in system infrastructure and a breach in the security environment are examples of events measured using KRIS technology. Kris can also impact all industries, but it could be more important for companies that rely on web portals and tech services.
Technical risk factors can range from increased operational complexity to security problems or changes in protocol and regulatory and governmental procedures. How is KRI different from KPI? Although the two are closely linked, the two are different. The two work together to give companies a platform to analyze the metrics they need to strengthen the organization.
Qualitative KRIs
KRIs are usually used to predict probability-based outcomes in sensitivity analyses. It might be better if the quantitative or qualitative criterion is used for a particular industry or business.
Alternatively, certain KRIs may be higher on the organization’s priority lists.
Financial KRIs
Quantitative financial KRIs may be more important for a commercial bank, investment firm, financial firm, or CPA. Examples of financial risk analysis (CRR) linked to external environmental variables may include those measuring economic downturns or regulatory changes.
Internal factors may affect the strategic objectives, limited budgets, or acquisition plans.
Operational KRIs
Operational KRI can measure anything from failing internal processes to uncontaminated internal controls. Factors impacting Kris’s threat could be process inefficiency, leadership changes, or strategic objectives.
Human Resources KRIs
Staffing and recruiting organizations will likely want to employ quantitative and qualitative, person-based KRIs.High employee-transaction rates and high turnover are examples of KRIs with low retention and importance.
Quantitative KRIs
These emphasize the provable fact and numerical evidence based on the results of mathematical models and analysis techniques.
Conclusion
If you’re thinking about using key risk indicators in your business, a dashboard can be a helpful way to track and monitor them. Having all your KRIs in one place allows you to easily see which areas need improvement and identify any potential issues before they become problems.
Implementing a KRI dashboard can help improve communication between departments, make data-driven decisions, and reduce risks in your business.

Chris Ekai is a Risk Management expert with over 10 years of experience in the field. He has a Master’s(MSc) degree in Risk Management from University of Portsmouth and is a CPA and Finance professional. He currently works as a Content Manager at Risk Publishing, writing about Enterprise Risk Management, Business Continuity Management and Project Management.

