Every risk matrix template in use today descends from a military document: MIL-STD-882, the Department of Defense system safety standard first published in July 1969 and still current as MIL-STD-882E Change 1, dated September 27, 2023. The likelihood-by-severity grid it standardized now runs risk registers from hospital boards to pension funds.
NASA stress-tested the format decades later. When its Engineering and Safety Center built a risk assessment matrix in 2005, the team concluded a 3×3 grid lacked resolution while anything beyond 5×5 became distracting, which is why the 5×5 anchors the agency’s risk management handbook and the template below.
| Risk Matrix Template: Key Takeaways |
| The risk matrix descends from MIL-STD-882, the Department of Defense system safety standard first published in July 1969 and still current as MIL-STD-882E Change 1 (September 2023). |
| NASA’s Engineering and Safety Center settled on the 5×5 grid in 2005 after finding a 3×3 too coarse for resolution and anything above 5×5 too distracting. |
| The free Excel workbook carries all three grid sizes, editable likelihood and impact scales, a self-scoring log with conditional formatting, and the band-to-action rules. |
| Every scale point needs a written definition in frequencies and dollars; undefined scales are how two assessors rate the same risk three cells apart. |
| Score = likelihood x impact, and a score on a band boundary takes the more severe band, a rule that ends most workshop arguments. |
| Tony Cox’s 2008 Risk Analysis paper showed matrices compress ranges and mis-order risks; the template’s written scales, conservative boundaries, and quantification hand-off answer the critique in practice. |
The download in this post is a working risk matrix template for Excel: 3×3, 4×4, and 5×5 tabs, editable likelihood and impact scales, and a scoring log that colors itself. The sections after it cover the choices that make a matrix defensible, because a grid with undefined scales is decoration.
Download the Risk Matrix Template (Excel)
The workbook ships ready to use and free to adapt: risk-matrix-template.xlsx. It follows the same build standard as our free KRI Excel template and the RCSA template for banks, the two most-downloaded files on this site, and it opens cleanly in Excel 2016 onward and Google Sheets.
| Workbook tab | What it contains |
| How to Use | Six operating rules, the boundary rule, and the band-to-action key |
| 5×5 Matrix | Color-coded 25-cell grid with 1-4 / 5-12 / 15-25 bands, the MIL-STD-882E and NASA working size |
| 4×4 Matrix | 16-cell grid for teams that want no middle column to hide in |
| 3×3 Matrix | 9-cell screening grid for fast triage and small registers |
| Scales & Bands | Editable likelihood definitions in frequencies and impact definitions in dollars, injuries, and disruption |
| Scoring Log | 30-row register with automatic score calculation, band assignment, and conditional-format coloring |
Adapt the workbook before rolling it out: delete the two grid sizes you rejected, rename the scoring log columns to your register vocabulary, and stamp your review date on the How to Use tab. The file sits alongside the wider template collection, the BIA template, and the heat map template as one set.
Color-Coding the Risk Matrix Template in Excel 365
The scoring log colors itself through three conditional formatting rules on the score column: greater than or equal to 15 fills red, 5 to 14 fills amber, 1 to 4 fills green. In Excel 365 the rules live under Home, Conditional Formatting, Manage Rules, and they travel with the file when you copy the tab.
Resist the urge to repaint cells by hand. Manual fills drift out of sync with scores within a quarter, while rule-based color always tells the truth about the number underneath, which matters when the register lands in front of an auditor asking why a 16 sits on a green cell.
Choosing a Risk Matrix Template Size: 3×3 vs 4×4 vs 5×5
Size is the first real decision, and NASA’s finding is the practical guide: resolution rises with grid size until it collapses into noise. The numbers behind that trade are countable, because each grid only produces so many distinct likelihood-times-impact scores.
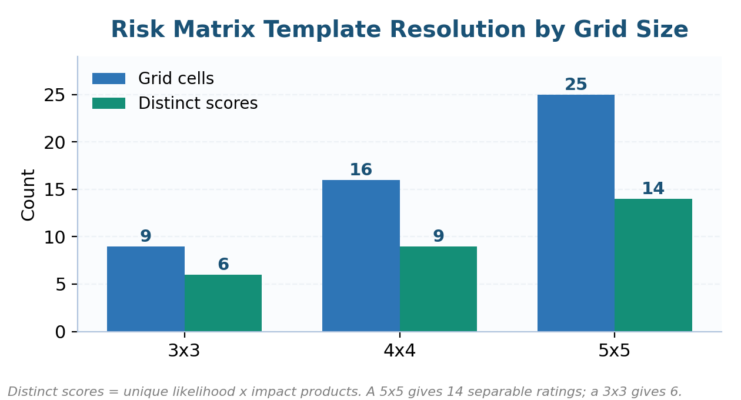
Figure 1. A 5×5 risk matrix yields 14 distinct scores against 6 for a 3×3, nearly half the resolution gain for free.
| Size | Strength | Weakness | Best fit |
| 3×3 | Fast; forces clear judgments; easy in workshops | Only 6 distinct scores; extreme range compression | Screening, small registers, field teams |
| 4×4 | No middle column; assessors must lean high or low | Unfamiliar bands; more calibration work | Teams that cluster everything at medium |
| 5×5 | 14 distinct scores; the regulatory and board default | Slower workshops; false precision risk | Corporate registers, board reporting, MIL-STD and NASA alignment |
Pick one size and standardize on it, because mixed sizes make registers impossible to aggregate. Our full 5×5 versus 4×4 scoring comparison walks the trade in depth, and the free online risk matrix generator lets you prototype either before committing the register.
One practitioner note from running these workshops: the middle column is where committees hide. When 70% of a register scores dead-center on a 5×5, switch that team to the 4×4 for two cycles; removing the safe middle forces the conversation the scores were avoiding.
Calibrating the Risk Matrix Template: Likelihood and Impact Scales
Calibration is where a risk matrix template earns credibility or loses it. IEC 31010, the risk assessment techniques standard behind ISO 31000, treats the matrix as valid only when every scale point carries a written definition, and the definition of likelihood is where most templates go soft.
| Score | Likelihood (edit to your context) | Impact (edit to your context) |
| 5 | Expected in most circumstances: more than once a year | Loss above $1M, fatality, national attention, regulator action |
| 4 | Will probably occur: once in 1 to 2 years | Loss $250K to $1M, serious injury, prolonged disruption |
| 3 | Could occur: once in 2 to 5 years | Loss $50K to $250K, medical treatment, local disruption |
| 2 | Not expected but possible: once in 5 to 10 years | Loss $10K to $50K, first-aid case, brief delay |
| 1 | Exceptional circumstances only: under once in 10 years | Loss under $10K, no injury, negligible impact |
The dollar bands above are the template’s starting values, sized for a mid-market US firm; a community bank and a utility will both rewrite them, and should. What cannot survive is a scale point defined only as the word possible, because qualitative scoring without anchors produces ratings that vary by assessor.
Impact usually needs more than one dimension, so the template’s impact column reads as the worst of financial, safety, and reputational harm at each level. Score the highest applicable dimension rather than averaging them, a convention consistent with the critical components of a risk assessment.
Score risk events, never hazards or bare causes. A wet floor is only a hazard; the scoreable risk is a customer injury carrying medical costs and a liability claim, and the hazard-versus-risk distinction decides what the likelihood number even refers to.
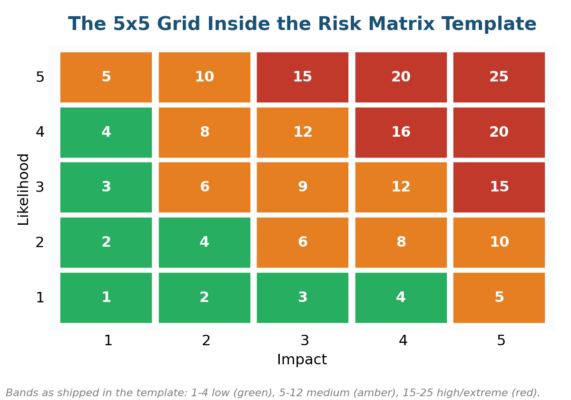
Figure 2. The template’s 5×5 as shipped: green 1-4, amber 5-12, red 15-25, with the boundary rule favoring severity.
From Risk Matrix Template Score to Register Action
A score that triggers nothing is trivia, so the template hard-wires bands to actions. The five-step risk management process supplies the frame: the matrix executes the analysis step, and the bands hand each risk to evaluation and treatment with an owner attached.
Sequence the workshop so the matrix arrives last: identify events first with structured identification techniques, agree each risk statement, then score. Teams that open the grid before the risk list is stable spend the session negotiating cells instead of naming exposures, the failure our step-by-step assessment guide sequences around.
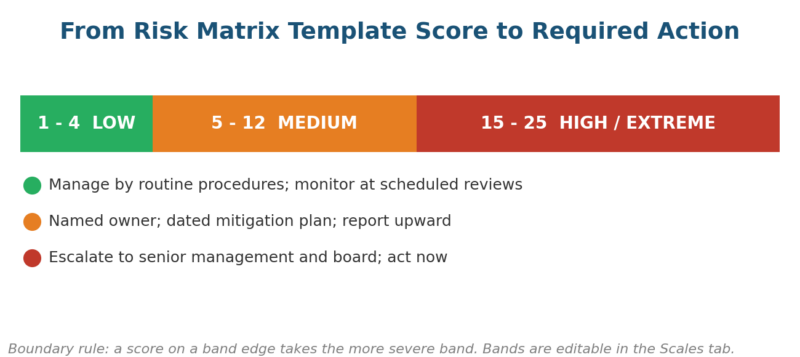
Figure 3. Bands do the arguing: each score range carries a pre-agreed response and escalation path.
| Band | Register action | Reporting line |
| 1-4 Low | Accept and monitor through routine procedures | Unit register; reviewed at scheduled cycle |
| 5-12 Medium | Assign a named owner and a dated mitigation action | Function leadership; tracked to closure |
| 15-25 High | Escalate immediately; treatment plan within days | Senior management and board risk committee |
Scores land in the risk register twice: inherent first, then residual with controls working as they actually operate. The gap between the two is your control value, and the register template and build guide shows the column structure that keeps both visible.
Regulated settings already expect this discipline in named forms. NIST SP 800-30 drives the same likelihood-impact logic for federal systems, FAA safety management systems run 5×5 grids in aviation, and OSHA’s safety management guidance expects hazard assessments a matrix operationalizes.
Risk Matrix Template Limitations: What the Critics Get Right
Honesty about the tool makes it stronger. Tony Cox’s 2008 paper in Risk Analysis, What’s Wrong with Risk Matrices?, showed that typical matrices can correctly compare fewer than 10% of random hazard pairs and can assign identical ratings to quantitatively different risks, a failure he named range compression.
The template’s design answers the critique where practice allows. Written frequency and dollar anchors shrink the subjectivity Cox measured, the boundary rule sends edge scores to the severer band, and the biggest exposures should graduate from the matrix to quantitative analysis once they clear the red line.
Treat the matrix as a triage instrument rather than a measurement device, the reading Cox’s peer-reviewed critique actually supports. It ranks conversations, allocates attention, and creates a defensible record; it does not price risk, which is why COSO-aligned programs pair it with scenario and capital work.
A related boundary keeps documentation clean: the matrix is not the heat map. The matrix is the scoring instrument; the heat map is the portfolio picture built from its outputs, and holding the two apart in your assessment methodology spares the register a chart that tries to do both jobs badly.
Red Flags to Watch in a Risk Matrix Rollout (And Green Lights to Chase)
Most matrix failures are visible in the file itself before any workshop. The table pairs the six warning signs we flag in client reviews of risk matrix templates with the working habits that replace them, and every fix is a settings change rather than a purchase.
| Signal area | Red flag | Green light |
| Scale definitions | Points labeled only rare or likely | Every point anchored in frequencies and dollars |
| Grid discipline | Different sizes across departments | One size, standardized, aggregable |
| Middle column | 70% of risks scored dead-center | 4×4 trial or forced-justification rule for 3s |
| Color control | Cells repainted by hand | Conditional formatting rules own the color |
| Boundary calls | Edge scores argued into the softer band | Written rule: boundaries take the severe band |
| Refresh cycle | Scales untouched since rollout | Annual recalibration plus post-incident review |
Risk Matrix Template FAQs: Expert Answers to Critical Questions
What is a risk matrix template?
A risk matrix template is a pre-built grid that scores risks by likelihood times impact, assigns each score to a color band, and ties every band to a required action. This one ships as an Excel workbook with 3×3, 4×4, and 5×5 tabs plus editable scales, following the format MIL-STD-882E standardized.
Which risk matrix template size should I use: 3×3, 4×4, or 5×5?
Default to the 5×5 for corporate registers and board reporting; it yields 14 distinct scores and matches MIL-STD-882E and NASA practice. Use the 3×3 for rapid screening and the 4×4 when assessors cluster everything in the middle column. Whichever you pick, standardize on it everywhere. Who approves those bands is a governance call; the risk management policy template assigns it to the board.
How do I make a risk matrix template in Excel with color coding?
Build the grid, then apply three conditional formatting rules to the score cells: 15 and above red, 5 to 14 amber, 4 and below green, using Home, Conditional Formatting, Manage Rules in Excel 365. The download already carries these rules, so adapting beats rebuilding.
What do the numbers in a risk matrix template mean?
Each cell is the product of a likelihood score and an impact score, so a 5×5 runs from 1 to 25. The number only means something when both scales carry written definitions, frequencies for likelihood and dollars or harm for impact, which is what the Scales tab enforces.
Is a risk matrix template enough for a full risk assessment?
No, and it is not meant to be. The matrix executes the analysis step inside a complete risk assessment process: identification comes before it, and evaluation, treatment, and monitoring follow. Your highest-scoring risks should graduate to quantitative analysis rather than retiring on a red cell.
How often should a risk matrix template be reviewed?
Recalibrate the scales annually and after any material incident or near miss, because dollar bands and frequency assumptions age quietly. The grid itself rarely changes; the definitions behind it must, and assessment frequency guidance maps the cadence to risk velocity.
Where the Risk Matrix Template Is Heading
Expect the matrix to keep its seat while its inputs professionalize. Registers are wiring likelihood scores to incident and near-miss feeds instead of memory, which quietly converts the same 5×5 grid from opinion capture into evidence display, and auditors have noticed the difference.
Quantification keeps pulling the top of the register away from grids. The pattern we now recommend to clients is two-tier: the matrix triages everything, and the handful of red-band exposures get loss modeling, the division of labor Cox’s critique pointed toward eighteen years ago.
Standards pressure will stay gentle but steady. IEC 31010 already lists the matrix as one technique among thirty, not the technique, and PMI’s risk management standard pushes the same message into project practice, while HSE’s UK guidance keeps the simple version alive for small employers. The template holds both audiences.
The format’s survival is the safest prediction of all. Fifty-six years after MIL-STD-882 standardized it, the likelihood-by-impact grid remains the one risk artifact every board member can read without training, and tools that everyone can read tend to outlive tools that impress.
Infographic: Build Your Risk Matrix in Six Steps
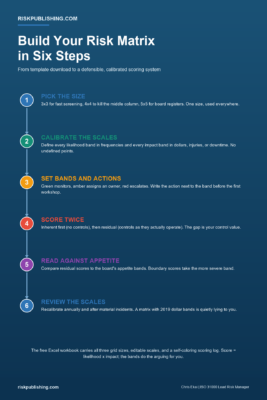
Figure 4. The whole article in one image: size, scales, bands, double scoring, appetite, review.
Calibrate Your Risk Matrix Template With Risk Publishing
A downloaded grid becomes a working control the day its scales match your loss history and its bands match your board’s appetite, and that calibration is exactly the work we do. Explore our services or contact us for an ISO 31000-aligned matrix calibration against your last three years of incidents and near misses.
Download the template here risk-matrix-template
Need the whole set?
The free file above stays free. The Risk Manager’s Toolkit bundles it with 39 other templates practitioners use: risk register, RCSA, business impact analysis with RTO and RPO, heat map, KRI scorecard, business continuity and disaster recovery plans, ISO 27001 and GDPR assessments. One download, Excel and Word, ready to edit.
Instant download after payment. 30-day refund, no questions. Secure checkout by Lemon Squeezy.
Get the ERM Risk Register Template (Excel)
Put this guide into practice without building from scratch: a ready-to-use Excel risk register with a live dashboard, 5×5 inherent and residual heatmaps, automatic risk appetite testing, and a KRI tracker. Aligned to ISO 31000:2018 and COSO ERM, with 12 worked sample risks included.
Buy the Risk Register Template – $29
Chris Ekai is a Risk Management expert with over 10 years of experience in the field. He has a Master’s(MSc) degree in Risk Management from University of Portsmouth and is a CPA and Finance professional. He currently works as a Content Manager at Risk Publishing, writing about Enterprise Risk Management, Business Continuity Management and Project Management.