General Motors booked $3.1 billion in tariff costs during 2025, close to a quarter of its earnings before interest and taxes. Ford chief executive Jim Farley summed up the year for analysts as a season of chaos, and his company’s own tariff bill still landed near $1 billion.
A monthly geopolitical risk report is how a risk team turns that chaos into a document the board can act on. The sections below give you the six-part template, the indicators that feed it, a five-day production cycle, and a worked example built for a US manufacturer.
| Monthly Geopolitical Risk Report: Key Takeaways |
| A monthly geopolitical risk report runs six sections in four to six pages: executive summary, watchlist, indicator movements, company exposure, scenario watch, and actions. |
| Demand is measurable: 59% of directors in the Willis 2026 D&O survey rate geopolitical risk very or extremely important, its first appearance in the top seven. |
| Anchor the indicators section on the Federal Reserve’s Geopolitical Risk Index by Caldara and Iacoviello, plus OFAC designation counts and USTR tariff actions. |
| Set green, amber, and red thresholds for every indicator and calibrate them against your risk appetite statement each quarter. |
| A five-day production cycle publishes the report two business days before the monthly risk committee, on analyst hours a mid-cap team can sustain. |
| End every issue with one decision ask. GM’s $3.1 billion tariff year shows what unmanaged geopolitical exposure costs a US manufacturer. |
Directors are asking for exactly this document. Geopolitical risk entered the top seven boardroom concerns for the first time in the Willis 2026 D&O survey, and 72% of executives in Clyde & Co’s Corporate Risk Radar now report direct commercial impact from geopolitical events.
Why a Monthly Geopolitical Risk Report Earns Board Time in 2026
The case for a standing monthly geopolitical risk report rests on how fast the survey numbers moved. EY-Parthenon’s 2026 CEO survey found 56% of 1,200 chief executives across 21 countries naming geopolitical instability their most significant risk, a 28-point jump since September 2025.
The World Economic Forum’s Global Risks Report 2026 placed geoeconomic confrontation at the top of its near-term ranking, with 18% of respondents calling it the risk most likely to trigger a global crisis. State-based armed conflict sits second at 14%, so economic weapons now outrank military ones.
Capital allocation feels the pressure first. In PwC’s 2026 Global CEO Survey, 32% of chief executives said geopolitical uncertainty makes them less likely to commit to large investments. Deferred capital is a quiet cost that never books to a line item, which is why boards want it monitored monthly.
| Source (2026) | Finding | Figure |
| Willis / WTW D&O survey | Directors rating geopolitical risk very or extremely important | 59% |
| EY-Parthenon CEO pulse | CEOs naming geopolitical instability their top 12-month risk | 56% |
| Clyde & Co Corporate Risk Radar | Executives reporting direct commercial impact from geopolitical events | 72% |
| PwC Global CEO Survey | CEOs delaying large investments over geopolitical uncertainty | 32% |
| WEF Global Risks Report | Respondents ranking geoeconomic confrontation the top 2026 risk | 18% |
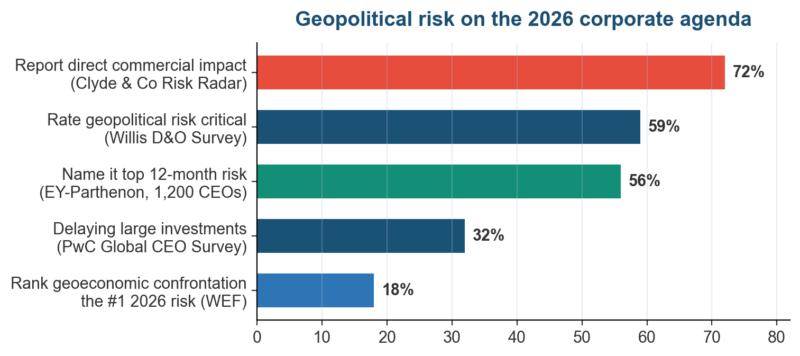
Figure 1. Five 2026 surveys converge: geopolitical exposure is now a first-order board topic in the United States.
What Boards Expect the Monthly Geopolitical Risk Report to Answer
Deloitte’s Center for Board Effectiveness frames board oversight of geopolitical risk in three questions: what exposure the company carries, how management monitors it, and what would trigger escalation. A monthly geopolitical risk report answers all three on a fixed cadence instead of after each shock.
Ad hoc briefings share one tell: they arrive after the tariff announcement, not before the sourcing decision. Put the report on a fixed monthly date and the conversation shifts from reaction to positioning. Cadence discipline is the single highest-payoff change a risk team can make here.
The Six Sections of a Monthly Geopolitical Risk Report Template
The monthly geopolitical risk report template below runs six sections across four to six pages. Anything longer stops being read, and anything shorter cannot carry real exposure analysis. Each section has one job, and together they follow the risk process in ISO 31000.
| Section | What it contains | Length |
| 1. Executive summary | Three to five sentences: overall risk direction, the biggest mover, and the one decision required this month | Half page |
| 2. Regional watchlist | Five to eight tracked situations, each with a rating, trend arrow, and one-line development note | One page |
| 3. Indicator movements | GPR index, sanctions counts, tariff actions, and freight rates plotted against thresholds | One page |
| 4. Company exposure | Revenue, suppliers, assets, and headcount mapped to the month’s movers | One page |
| 5. Scenario watch | One escalation scenario per quarter with named trigger conditions | Half page |
| 6. Actions and decisions | Owner, action, and deadline for every open item, with aging from prior months | Half page |
Scale the template to the company, not the ambition. A $500 million manufacturer might run four pages with three indicators, while a multinational bank runs six pages with a dozen. The section order stays fixed either way, because readers build muscle memory for where decisions live.
Executive Summary and Watchlist in the Monthly Geopolitical Risk Report
Write the executive summary last and cap it at five sentences. State whether aggregate exposure rose or fell, name the single biggest mover, and flag the one decision leadership must take this month. Many readers stop there, so the summary has to stand alone.
The watchlist holds five to eight situations with a direct line to company operations, and it stops there. Score each on the same likelihood and impact scale as your enterprise register, using a standard 5×5 risk assessment matrix so geopolitical ratings translate cleanly into the corporate risk heat map.
Exposure and Actions in the Monthly Geopolitical Risk Report
Exposure is where generic commentary becomes company-specific analysis. Map each watchlist item to revenue by region, single-source suppliers, in-country assets, and local headcount. Your existing concentration risk analysis for third parties already supplies most of the supplier-side data, so no new fieldwork is needed.
Close with an actions table naming an owner and a deadline for every open item, and carry unresolved items forward visibly until closed. Boards forgive a bad month. They do not forgive the same unowned action appearing in three consecutive geopolitical risk reports.
Indicators That Feed the Monthly Geopolitical Risk Report
Quantified geopolitical risk indicators separate a monthly report from an opinion column. The Federal Reserve publishes the Geopolitical Risk Index built by Dario Caldara and Matteo Iacoviello, a monthly count of adverse geopolitical coverage in leading newspapers with history reaching back to 1900.
The GPR index splits into a Threats component and an Acts component, which lets the report distinguish rising rhetoric from realized conflict. The peer-reviewed methodology in the American Economic Review links index spikes to lower investment and employment, the transmission a CFO cares about.
| Indicator | Green | Amber | Red | Source |
| GPR index, monthly average | Below 100 | 100 to 150 | Above 150 | Federal Reserve |
| New OFAC designations touching your sectors | 0 | 1 to 2 | 3 or more | US Treasury OFAC |
| New tariff or export-control actions on traded lanes | 0 | 1 | 2 or more | USTR and BIS |
| Container freight rate change on key lanes, month over month | Under 10% | 10% to 25% | Over 25% | Carrier indices |
| Watchlist items rated high | 0 to 1 | 2 to 3 | 4 or more | Internal register |
Treat thresholds as risk appetite statements in miniature. Calibrate each band against your risk appetite statement and revisit the bands quarterly, the same discipline a mature KRI program applies. Thresholds that never trip are set too loose, and thresholds that trip monthly are noise.
Building Monthly Geopolitical Risk Report Indicators From Existing Dashboards
Most risk teams already run indicator dashboards for credit, liquidity, and operations. Geopolitical measures slot into the same KRI dashboard architecture with the green-amber-red conventions the board already reads, and the same board-ready ERM dashboard formats carry them without new tooling.
Banks have run this playbook for years, wiring sanctions counts into the same racks as credit union and bank KRIs and liquidity risk indicators. Corporates can copy the pattern directly. Measuring geopolitical risk is a data-wiring problem before it is an analytical one.
Version the data the way finance versions a close. Snapshot every indicator on the same calendar day each month, archive the values with the issue, and mark any restatement explicitly. Twelve archived issues become a trend record no consultant deck can reproduce, and auditors accept it as evidence.
A Five-Day Production Cycle for the Monthly Geopolitical Risk Report
A monthly geopolitical risk report that consumes three analyst weeks will not survive budget season. The five-day cycle below produces the document in one working week, timed so the report publishes two business days before the monthly risk committee sits.
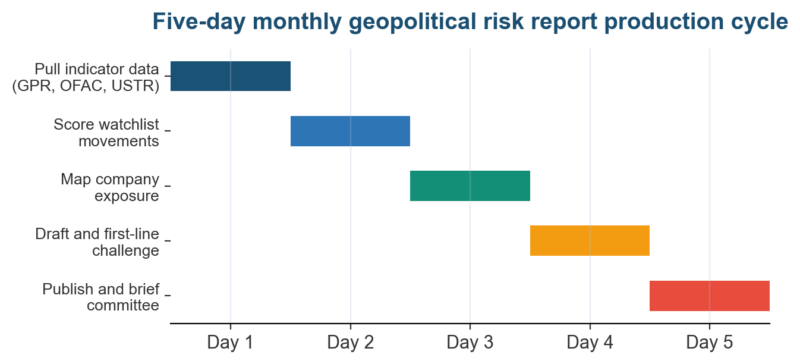
Figure 2. One working week from indicator pull to committee briefing keeps the report affordable and current.
| Day | Task | Source or output |
| Day 1 | Pull indicator data | Federal Reserve GPR release, OFAC recent actions, USTR announcements |
| Day 2 | Score watchlist movements | News review, country risk services, regional desk input |
| Day 3 | Map company exposure | ERP revenue cuts, supplier master file, HR headcount data |
| Day 4 | Draft and challenge | Risk team draft with first-line management review |
| Day 5 | Publish and brief | Committee pack, distribution list, archived issue |
Day three is where the report earns its budget. Watch the supplier master file first, because single-source components in affected trade lanes move faster than revenue exposure ever does. Supply chain key risk indicators flag those chokepoints before the monthly cycle even starts.
Distribution deserves the same design attention as production. The risk committee gets the full report, the disclosure committee gets the exposure section for its quarterly evidence file, and the strategy team gets the watchlist. One document serves all three audiences and spares the team reconciling forked versions later.
Standards give the exposure mapping a permanent home. NIST SP 800-161 treats supplier risk mapping as a standing capability with its own controls and refresh cycle, and our NIST C-SCRM implementation guide with the ISO 28000 supply chain framework shows how both feed a monthly geopolitical risk report.
Worked Example: A Monthly Geopolitical Risk Report for a US Manufacturer
Picture a mid-cap US industrial manufacturer with Mexican assembly, Taiwanese chip supply, and 22% of revenue from European customers. Its July 2026 monthly geopolitical risk report opens on tariff exposure, because tariffs are where 2025 hurt the sector’s income statements most.
The benchmarks are public. GM’s $3.1 billion tariff bill and Ford’s roughly $1 billion set the scale boards recognize, while Apple absorbed about $800 million in a single quarter. Global automakers gave up more than $30 billion of 2025 operating profit to tariffs.
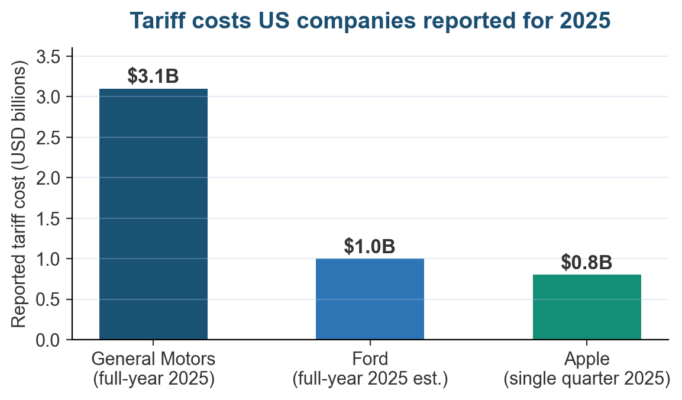
Figure 3. Reported 2025 tariff costs give the worked example board-recognizable benchmarks for exposure framing.
| Watchlist item | Rating | Trend | Exposure line |
| US-Mexico tariff review | 16 High | Rising | $180M assembly cost base |
| Taiwan Strait tension | 12 Medium | Stable | 3 single-source chip lines |
| EU carbon border adjustment | 9 Medium | Rising | 22% of revenue |
| Red Sea shipping disruption | 8 Medium | Falling | 14-day lead time buffer |
| Second-tier supplier sanctions | 6 Low | Stable | 2 flagged sub-suppliers |
The indicator section for July would show the GPR index at 138 and amber for a second month, two new OFAC designations touching the electronics supply base, and one new tariff action on the Mexico lane. Freight rates moved 6%, staying green. The whole indicator section fits on one page.
Reading the Example Monthly Geopolitical Risk Report
The example’s executive summary would read: aggregate exposure rose for a third consecutive month, driven by the tariff review, and the decision required is approval of a second-source qualification budget. One direction, one mover, one ask. That is the entire discipline.
Note what the example leaves out: no essay on the global order and no watchlist item without a named exposure line. For the scenario section, borrow from business continuity exercise scenarios your team has already tested, so trigger conditions arrive pre-agreed and the scenario section takes minutes to write.
Frequently Asked Questions About the Monthly Geopolitical Risk Report
How long should a monthly geopolitical risk report be?
Four to six pages covering six sections, readable in fifteen minutes. The executive summary must stand alone in half a page because some directors read nothing else. If the report keeps growing past six pages, the watchlist is carrying items with no named company exposure.
Who should own the monthly geopolitical risk report?
The second-line risk function owns production and the chief risk officer signs it, with named first-line contributors for supply chain, treasury, and regional operations. Ownership by a strategy team or an external consultancy weakens the link to the risk register and slows the five-day cycle.
What indicators belong in a monthly geopolitical risk report?
Start with five: the Federal Reserve’s GPR index, new OFAC designations touching your sectors, tariff and export-control actions on your trade lanes, freight rate movement, and the count of high-rated watchlist items. Each carries green, amber, and red thresholds tied to your appetite statement.
How is a monthly geopolitical risk report different from a country risk report?
A country risk report goes deep on one geography, usually for a market-entry or credit decision, built on the key indicators of country risk. The monthly geopolitical risk report is a portfolio view: every material situation the company touches, scored on one scale and mapped to revenue, suppliers, assets, and people.
Which frameworks support a monthly geopolitical risk report?
ISO 31000 supplies the risk process and COSO ERM supplies the governance integration, and the differences between the two frameworks matter far less than consistency with your existing register. WEF’s global risk taxonomy also helps standardize watchlist category names across business units and regions.
What does a monthly geopolitical risk report cost to produce?
Budget roughly five analyst days per month plus whatever country risk services you already license, since the core feeds from the Federal Reserve, OFAC, and USTR are free. That is under a tenth of what quarterly consultant briefings cost, and the output compounds into a trend archive you own.
What feeds should a monthly geopolitical risk report start with?
Wire three public feeds first: the GPR index from the Federal Reserve, OFAC recent actions, and USTR trade actions. Add freight indices and internal watchlist ratings in month two. Most teams reach a defensible first issue inside thirty days using data they already license.
Monthly Geopolitical Risk Report Pitfalls and Remedies
Seven failure patterns recur when companies stand up a monthly geopolitical risk report, and each has a structural remedy: a process change, an owner, or a cap. Fix the process and the report largely fixes itself, which is the same lesson every risk management KPI program teaches.
| Pitfall | Root cause | Remedy |
| World-tour watchlist | Analyst enthusiasm outruns company exposure | Cap at eight items, each with a named exposure line |
| No decision ask | Report written as briefing, not governance input | End the summary with one decision required |
| Thresholds never trip | Bands set to avoid uncomfortable ambers | Calibrate to appetite and review quarterly |
| Same unowned actions recur | No owner or deadline recorded | Actions table with owner, date, and aging column |
| Commentary without numbers | No indicator feed wired in | Pull GPR, OFAC, and USTR data on day one |
| Report lands after committee | Production cycle runs too long | Five-day cycle publishing two days before the meeting |
| Scenario essays from scratch | Scenario work disconnected from continuity planning | Reuse tested business continuity scenarios |
Of the seven, the missing decision ask does the most damage because it is invisible. The report reads well, the committee nods, and nothing changes month after month. One forcing question fixes it: if this issue requires no decision, say so explicitly and let the record show a deliberate hold.
Where the Monthly Geopolitical Risk Report Goes Next
Disclosure pressure will formalize the document. SEC risk-factor expectations already push registrants toward specific, quantified discussion of tariff and sanctions exposure, and a standing monthly geopolitical risk report gives the disclosure committee a standing evidence trail for each quarter’s filing.
By January 2027, expect the report’s center of gravity to sit in economic statecraft rather than armed conflict. The WEF two-year rankings already show state-based conflict falling to fifth while geoeconomic confrontation hardens, which means tariffs, export controls, and industrial policy will dominate the watchlist.
Spend on data before headcount. The GPR index is free, OFAC and USTR feeds are free, and one analyst plus wired feeds beats three analysts reading newspapers. PwC’s finding that 32% of CEOs are delaying major investments gives the report a second audience in the strategy team.
Sector versions will follow the same pattern risk appetite statements took by sector: a common six-section spine with industry-specific indicators layered on top. The annual geopolitical risk assessment remains the deep-dive that sets the watchlist; the monthly geopolitical risk report is its operating rhythm.
Infographic: The Monthly Geopolitical Risk Report at a Glance
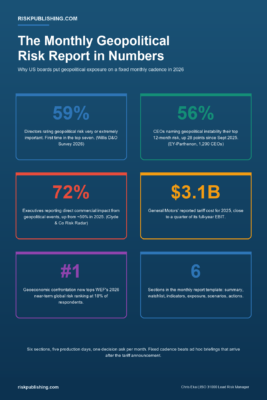
Figure 4. Six numbers that justify a fixed monthly cadence for geopolitical risk reporting in 2026.
Build Your Monthly Geopolitical Risk Report With Risk Publishing
We help chief risk officers at US mid-cap manufacturers stand up a monthly geopolitical risk report their board actually reads: the template, the indicator wiring, and the first three issues produced together. Start with our advisory services and book a scoping call through our contact page. The first issue is the hardest; every one after runs on rails.

Chris Ekai is a Risk Management expert with over 10 years of experience in the field. He has a Master’s(MSc) degree in Risk Management from University of Portsmouth and is a CPA and Finance professional. He currently works as a Content Manager at Risk Publishing, writing about Enterprise Risk Management, Business Continuity Management and Project Management.