On December 1, 2025, retired Circuit Judge Dennis Hupp, chair of the Virginia Criminal Sentencing Commission, delivered the annual Pretrial Data Project report to Chief Justice Bernard Goodwyn and Governor Glenn Youngkin. Every defendant in it was scored with a Virginia risk assessment tool, and the numbers cover 72,439 people charged during 2023.
The report landed at a turning point. The Virginia Pretrial Risk Assessment Instrument, or VPRAI, the tool that made Virginia the first state to score pretrial risk statewide, is being retired in favor of the Public Safety Assessment, with trainers working in localities from March 2025 through February 2026.
We wrote this guide for the pretrial officers, defense counsel, and risk professionals who need the current picture. It covers how the Virginia risk assessment tool scores defendants, what five years of outcome data show, and what the switch to the PSA changes for anyone who reads or challenges those scores.
What the Virginia Risk Assessment Tool Is and Where It Came From
Start with the origin story, because it explains the tool’s authority. In 2003, the Virginia Department of Criminal Justice Services and researcher Marie VanNostrand of Luminosity built the VPRAI from Virginia case data, and by January 2005 every pretrial services agency in the Commonwealth was using it.
That made Virginia the first state to run a single actuarial pretrial instrument statewide, a milestone the Bureau of Justice Assistance documents in its instrument profile. If the discipline is new to you, our primer on what a risk assessment is explains the underlying logic of likelihood and consequence.
The instrument traveled well beyond the Commonwealth. Riverside County, California completed a local validation of the VPRAI in 2016, and versions of the tool have reached at least 43 counties across 11 states, according to the Mapping Pretrial Injustice project, which catalogs instruments nationwide.
State law anchors the system. Virginia Code section 19.2-134.1 requires the Sentencing Commission to report pretrial data every December 1, and 35 pretrial services agencies now serve 116 of Virginia’s 133 cities and counties. The full risk assessment process runs on that statutory footing.
| Year | Virginia Risk Assessment Tool Milestone |
| 2003 | DCJS and Luminosity build the VPRAI from Virginia pretrial case data and begin phasing it in |
| 2005 | Statewide use across all Virginia pretrial services agencies completed in January |
| 2009 | First major revalidation and revision of the instrument, led by Luminosity |
| 2016 | VPRAI-Revised launches with weighted factors and race- and gender-neutral scoring; Praxis decision matrix pairs scores with release recommendations |
| 2018 | Virginia State Crime Commission launches the Pretrial Data Project on an October 2017 cohort |
| 2021 | House Bill 2110 and Senate Bill 1391 make cohort reporting an annual statutory duty |
| 2025-2026 | DCJS and the Center for Effective Public Policy implement the Public Safety Assessment statewide, from March 2025 through February 2026 |
Inside the VPRAI-R: How the Virginia Risk Assessment Tool Scores Risk
History explains the authority; the scoring sheet explains the decisions. The revised instrument, launched in 2016 as the VPRAI-R, weighs eight factors drawn from a defendant’s record and circumstances, and DCJS states the revision made the Virginia risk assessment tool free from race and gender predictive bias.
Scoring is not armchair work. A pretrial officer interviews the defendant, verifies the answers against court and supervision records, and only then totals the weighted factors; the VPRAI-R training manual treats the verified interview as part of the instrument itself.
The Eight Factors Behind the Virginia Risk Assessment Tool Score
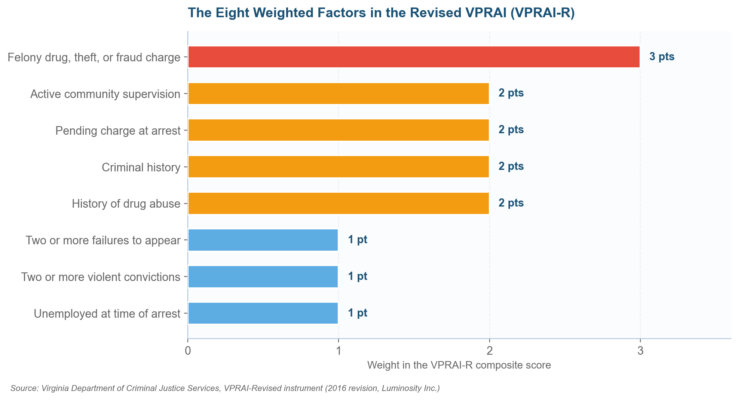
Figure 1. A felony drug, theft, or fraud charge carries the heaviest weight in the VPRAI-R composite score.
Scores sort defendants into tiers, and each tier maps to a release recommendation through the Praxis decision matrix, which pairs the risk level with the charge category. This is textbook actuarial method; our comparison of qualitative vs quantitative risk assessment shows why agencies accept that tradeoff.
Outcome data supports the tiering. Among supervised defendants, DCJS reported an 87.4% success rate for the lowest risk category, 82.0% for average risk, 75.7% for above average, and 67.7% for high risk, a clean gradient that mirrors how likelihood bands behave in any scoring model.
| VPRAI-R Risk Level | Supervised Success Rate | Failure Rate |
| Below average risk | 87.4% | 12.6% |
| Average risk | 82.0% | 18.0% |
| Above average risk | 75.7% | 24.3% |
| High risk | 67.7% | 32.3% |
The Virginia Risk Assessment Tool Is Changing: VPRAI-R Out, PSA In
Those success rates kept the VPRAI-R in service for nearly a decade, yet Virginia is now replacing it. The Center for Effective Public Policy, working with DCJS, is helping localities adopt the Public Safety Assessment from March 2025 through February 2026, building on learning sites in Prince William County, Richmond, and Staunton.
The PSA is a different kind of instrument. Arnold Ventures built it from 1.5 million cases across roughly 300 jurisdictions, and it produces two scales that run from 1 to 6, one for failure to appear and one for new criminal arrest, plus a flag for elevated violence risk.
Nine factors drive those scales, and none of them touch employment, income, education, or neighborhood. The Sentencing Commission already scores every annual cohort with the PSA because it can be calculated entirely from automated records, a practical edge Advancing Pretrial Policy and Research highlights in its profile of Virginia’s data work.
| Attribute | VPRAI-R | Public Safety Assessment (PSA) |
| Factors scored | Eight weighted factors, including employment and drug abuse history | Nine factors from criminal history and age; no socioeconomic inputs |
| Output | Single composite risk level with Praxis release recommendation | Two 1-to-6 scales (FTA and NCA) plus a violence flag |
| Data needed | Verified defendant interview plus records | Automated court and criminal history records only |
| Development base | Virginia pretrial case data, revalidated 2009 and 2016 | 1.5 million cases from about 300 US jurisdictions |
| Owner | Virginia DCJS with Luminosity | Arnold Ventures |
Independent evidence backs the change. MDRC’s multi-site evaluation found PSA adoption, combined with broader reforms, was associated with higher release rates and less reliance on money bail, and our Ohio Risk Assessment System scoring guide shows how a neighboring state’s framework handles the same tradeoffs.
What 72,439 Cases Show About the Virginia Risk Assessment Tool at Work
Whatever instrument sits on the desk, outcomes are the real test. The 2025 report gives the fullest picture yet, drawing more than 500 data elements per defendant from eight separate state and local systems and tracking each case through disposition or a 15-month follow-up window, whichever arrives first.
Five Years of Release Data From the Virginia Risk Assessment Tool Era
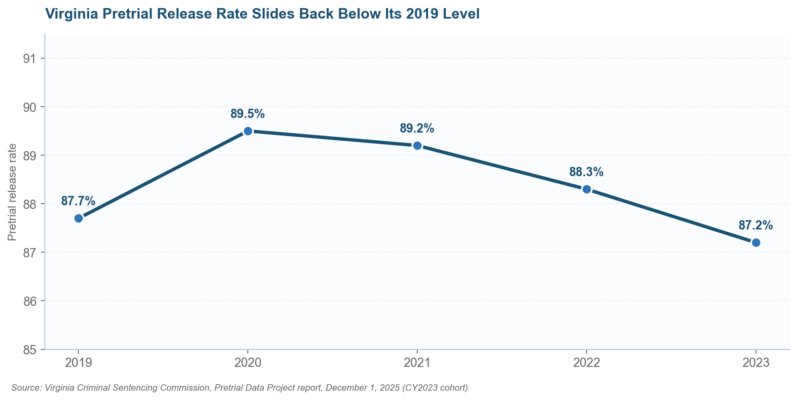
Figure 2. The 2023 release rate of 87.2% is the first reading below the pre-pandemic 2019 level.
Release peaked at 89.5% in 2020 and has slipped every year since, landing at 87.2% in 2023, the first reading below the pre-pandemic 87.7%. Detention through disposition climbed from 10.8% of defendants in 2021 to 12.8% in 2023, according to the project the State Crime Commission launched in 2018.
Charge mix shapes everything downstream. About 46% of defendants faced a felony as their most serious charge, drug offenses led the felony list every year, assault led the misdemeanors, and between 52% and 54% of defendants were ultimately convicted of at least one offense in the contact event.
Release mechanics stayed stable. In 2023, 57.9% of defendants left jail on personal recognizance or an unsecured bond and 29.4% posted a secured bond, while the rest remained in custody until their cases resolved, a distribution that has moved barely a point since 2021.
Failure to Appear Trends in Virginia Risk Assessment Tool Outcomes
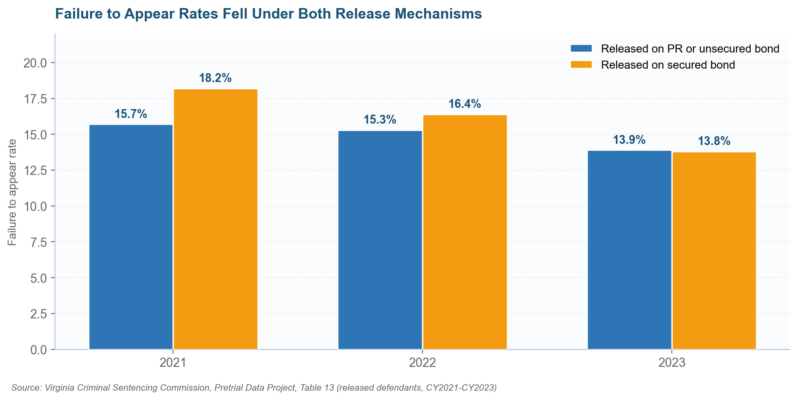
Figure 3. By 2023, failure to appear rates converged near 13.9% for both release mechanisms.
Both outcome measures improved. The failure to appear rate fell from 16.6% in 2021 to 13.9% in 2023, though it remains above the 12.6% recorded in 2019, and the new in-state arrest rate dropped from its 23.5% pandemic-era peak in 2020 to 18.6% in 2023.
| Outcome for Released Defendants | 2021 | 2022 | 2023 |
| Failure to appear, PR or unsecured bond | 15.7% | 15.3% | 13.9% |
| Failure to appear, secured bond | 18.2% | 16.4% | 13.8% |
| New criminal arrest, PR or unsecured bond | 18.9% | 18.9% | 17.3% |
| New criminal arrest, secured bond | 25.5% | 24.2% | 21.4% |
PSA Scores and Release Decisions in the Virginia Risk Assessment Tool Data
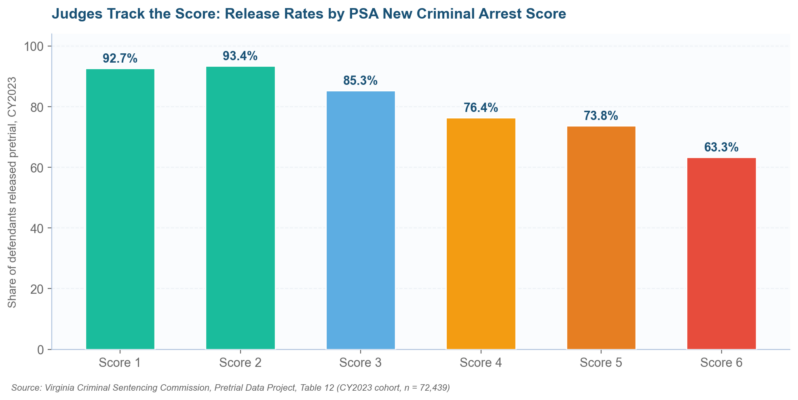
Figure 4. Release rates fall almost thirty points between the lowest and highest PSA new criminal arrest scores.
Scores and decisions track each other tightly. Defendants scoring 1 on the PSA’s new criminal arrest scale were released 92.7% of the time in 2023, while those scoring 6 were released 63.3% of the time, and failure rates rose with scores in step. Practitioners who conduct a risk assessment for a living call that calibration.
Supervision shows up clearly in the numbers. Defendants under pretrial services supervision had significantly lower failure to appear rates, and for those scoring 3 or higher on the PSA, supervision was also associated with significantly fewer new arrests. Between 16.8% and 18.6% of released defendants were ordered to supervision each year.
Does the Virginia Risk Assessment Tool Work? Evidence, Bias, and Pushback
Strong calibration does not settle the argument, because the stakes are national. At midyear 2023, 70% of the 664,200 people in American jails, some 467,600 individuals, had not been convicted of anything, per the Bureau of Justice Statistics, and tools like Virginia’s help decide who joins them.
Bias is the sharpest critique. ProPublica’s 2016 Machine Bias investigation into the COMPAS tool put racial disparity at the center of the national debate, and Virginia answered early: the 2016 VPRAI-R revision was engineered specifically to remove race and gender predictive bias from the score.
Skeptics still hold real cards. A 2024 analysis for the National Association of Criminal Defense Lawyers probed the project’s microdata for disparities, and a 2025 study in Criminal Justice Policy Review found New Jersey judges frequently detained defendants the PSA rated releasable. Instruments inform decisions; they do not make them.
Adoption without measurement is the quieter failure. When the Mapping Pretrial Injustice team surveyed jurisdictions, only nine reported jail populations falling after adopting a risk tool, and roughly two thirds did not track the effect at all, a gap Virginia’s mandated annual reporting exists to close.
Reading the Virginia Risk Assessment Tool as an Enterprise Risk Practitioner
We read instruments like this professionally, and the lessons carry well beyond criminal courts. The Virginia risk assessment tool is a scored model with defined factors, tiered outputs, and a published validation trail, which is exactly what ISO 31000 expects of any risk assessment technique an organization relies on.
The pattern repeats across sectors. The NFPA risk assessment tool grades fire protection decisions, the FFIEC Cybersecurity Assessment Tool tiers bank cyber maturity, and the GAR risk assessment model scores operational missions before launch, each one trading expert nuance for consistency.
Specialized instruments go further still. Pharmaceutical teams categorize trials with the RACT risk assessment categorization tool, security teams lean on the CRAMM risk assessment method, and engineers apply the NUDD risk assessment to novel designs, all cousins of the same actuarial idea.
The governance lesson matters most. Virginia revalidated its instrument in 2009, revised it in 2016, and replaced it in 2025, the cadence any step-by-step guide to risk assessment recommends for scoring models. Track your tool’s hit rate the way you track key risk indicator examples, and rebuild when drift appears.
Documentation closes the loop. A risk assessment matrix template makes tier boundaries explicit, the key elements of a risk register keep override decisions auditable, and zero risk assessment sample questions help teams pressure-test assumptions before a regulator or a defense attorney does.
The Virginia Risk Assessment Tool: Your Questions Answered
What is the Virginia risk assessment tool used for?
It estimates the likelihood that a defendant released before trial will fail to appear in court or be arrested for a new offense. Pretrial services staff score the instrument after arrest, and magistrates and judges weigh the result, alongside the charge itself, when setting release and supervision conditions.
Is the VPRAI still the Virginia risk assessment tool of record?
It is being phased out. DCJS and the Center for Effective Public Policy began moving localities to the Public Safety Assessment in March 2025, with statewide training running through February 2026. The Sentencing Commission already uses the PSA to score every annual research cohort in the Pretrial Data Project.
How does the Virginia risk assessment tool score a defendant?
The VPRAI-R sums eight weighted factors, led by a three-point weight for a felony drug, theft, or fraud charge and two points each for pending charges, criminal history, active supervision, and drug abuse history. The total places the defendant in a risk tier tied to a Praxis release recommendation.
Is the Virginia risk assessment tool biased?
DCJS designed the 2016 VPRAI-R revision to be free of race and gender predictive bias, and the incoming PSA excludes employment, income, education, and neighborhood entirely. Researchers still audit outcomes for disparity, because a neutral instrument can feed a decision process that is anything but neutral.
How accurate is the Virginia risk assessment tool?
Calibration at the tier level is strong. Supervised success rates fall cleanly from 87.4% in the lowest risk category to 67.7% in the highest, and 2023 failure to appear and new arrest rates rise step by step with PSA scores. No instrument predicts individual behavior with certainty.
Can other states adopt the Virginia risk assessment tool?
Many already have: versions of the VPRAI have been used in at least 43 counties across 11 states, and Riverside County, California ran its own validation study. Any adopter should revalidate on local data first, because factor weights built on Virginia cases may not transfer cleanly elsewhere.
Where the Virginia Risk Assessment Tool Goes Wrong and the Fixes That Work
Every jurisdiction that adopts a scored instrument hits a familiar set of snags, and Virginia’s twenty-year record shows both the snags and the repairs. The table below pairs the five failure modes we see most often with the remedy that has actually worked in the Commonwealth or its peer states.
| Pitfall | Root Cause | Remedy |
| Scores treated as verdicts | Judges rubber-stamp the number or ignore it entirely | Pair scores with a Praxis-style decision matrix and require documented reasons for overrides |
| Stale factor weights | Instrument never revalidated on the current population | Follow Virginia’s cadence: revalidate (2009), revise (2016), replace (2025) |
| Data entry drift | Interview answers and records keyed inconsistently across agencies | Score from automated court records where possible, as the PSA does |
| Bias by proxy | Employment or housing factors stand in for income and race | Drop socioeconomic inputs, as both the VPRAI-R revision and the PSA did |
| No outcome tracking | Agencies never learn their own failure rates | Publish FTA and new arrest rates annually, as Virginia Code section 19.2-134.1 mandates |
Three Shifts Coming for the Virginia Risk Assessment Tool Through 2028
February 2026 is the nearest marker. That is when the current statewide implementation window closes, and DCJS will face the question every rollout faces: which localities sustain the Public Safety Assessment with fidelity, and which quietly drift back to old habits once the trainers leave.
Out-of-state records come next. About 30% of defendants in the 2022 cohort had criminal history beyond Virginia, and the Commission’s FBI data request, delayed by the October 2025 federal shutdown, will eventually fold those records into pretrial risk research for the first time.
Expect the transparency bar to keep rising. Virginia law already requires an interactive public dashboard of pretrial outcomes, and annual cohorts above 70,000 defendants give researchers a dataset few states can match, which is why national pretrial groups now point to the Commonwealth as the model.
For risk teams, the takeaway is durable. Build instruments on real outcome data, publish the factors, revalidate on a schedule, and be willing to retire your own creation when a better-calibrated model appears. Virginia managed all four inside two decades, and the discipline shows in its numbers.
Put the Virginia Risk Assessment Tool’s Lessons to Work With Risk Publishing
Pretrial agencies inherit their instruments from DCJS; enterprise risk teams have to build their own. See how we help on our services page, where scoring-model design and validation sit alongside ISO 31000 reviews, and reach us through the contact page when you want a defensible instrument of yo

Chris Ekai is a Risk Management expert with over 10 years of experience in the field. He has a Master’s(MSc) degree in Risk Management from University of Portsmouth and is a CPA and Finance professional. He currently works as a Content Manager at Risk Publishing, writing about Enterprise Risk Management, Business Continuity Management and Project Management.