A risk-free rate is the return an investor earns on an asset with no chance of default, and it is the minimum return any riskier investment must beat. In practice the US risk-free rate is taken from Treasury yields: short bills for short horizons and 10-year or 20-year bonds for long-term valuation.
On September 2, 2026, Kroll changed the risk-free rate guidance that valuation teams across the US follow. According to its updated recommendation table, Kroll dropped the 3.5% normalized rate it had used since 2022 and now recommends the spot 20-year Treasury yield, paired with a 5.0% equity risk premium.
On September 16, the Federal Open Market Committee voted 12-0 to raise its target range to 3.75% to 4.00%, according to its policy statement. CNBC noted it was the Fed’s first rate increase since July 2023. By September 25, the 20-year yield stood at 5.54%, more than two points above the old normalized figure.
| Risk-Free Rate: Key Takeaways |
| A risk-free rate is the return on an investment with no default risk, used as the starting point for pricing every riskier asset. In US dollars, analysts use Treasury yields as the proxy. |
| Match the maturity to the use: the 3-month bill for short horizons and the Sharpe ratio, the 10-year or 20-year Treasury for long-term valuation. Kroll switched to the spot 20-year yield from September 2, 2026. |
| On September 25, 2026 the 3-month bill yielded 4.24%, the 10-year note 5.17%, and the 20-year bond 5.54%. The 10-year TIPS real yield was 2.83%. |
| The Federal Reserve raised its target range to 3.75% to 4.00% on September 16, 2026, its first increase since July 2023. SOFR, the overnight risk-free rate for derivatives, was 3.88%. |
| No rate is completely free of risk. Damodaran now subtracts a 0.23% default spread from the US Treasury rate, reflecting the Aa1 rating, and inflation can still erode a nominal return. |
| Use the risk-free rate in the same currency and inflation basis as the cash flows. A dollar rate for dollar cash flows, a real rate for real cash flows. |
What a Risk-Free Rate Is
The idea comes from asset pricing theory. When William Sharpe shared the 1990 Nobel Prize, the Nobel committee’s announcement described his capital asset pricing model as combining a risk-free investment, such as Treasury bills, with the market portfolio. Every expected return in the model starts from that rate and adds compensation for risk.
Aswath Damodaran’s valuation notes at NYU Stern set two conditions for a truly risk-free investment: no default risk and no reinvestment risk. The second condition means the asset’s maturity should match the timing of the cash flow being valued, which is why one number rarely fits every purpose.
| Term | Meaning | Example value |
| Nominal risk-free rate | Yield on a default-free bond, including expected inflation | 10-year Treasury: 5.17% (September 25, 2026) |
| Real risk-free rate | Yield after inflation, observed on inflation-indexed bonds | 10-year TIPS: 2.83% (September 25, 2026) |
| Overnight risk-free rate | Cost of overnight borrowing secured by Treasuries | SOFR: 3.88% (September 24, 2026) |
| Policy rate | Central bank target that anchors short rates | Fed funds target: 3.75% to 4.00% |
| Equity risk premium | Extra return investors want for holding stocks | Kroll: 5.0%; Damodaran implied: 4.23% mature market |
The risk-free rate sits at the base of three common calculations. The first is the cost of equity under CAPM. The second is the discount rate for a net present value or internal rate of return test, and the third is the Sharpe ratio, which measures return above the risk-free rate per unit of volatility.
Risk teams use it too. Market risk measures such as rates VaR are built on the Treasury curve, and our guide to market risk KRIs covers indicators tied to it. The wider picture of risk in finance explains how the risk-free rate separates compensated risk from pure time value.
Why No Rate Is Truly Free of Risk
Every proxy carries some risk, and the question is which risks matter for the task. A Treasury bill held to maturity is close to free of default and price risk, but its return can still fall behind inflation. A 20-year bond sold before maturity can lose value when yields rise.
| Remaining risk | Why it applies | How analysts handle it |
| Default risk | The US is rated Aa1 by Moody’s, not Aaa | Damodaran subtracts a 0.23% default spread from the Treasury rate |
| Inflation risk | Nominal yields do not protect purchasing power | Use TIPS yields for real cash flows |
| Interest rate risk | Bond prices fall when yields rise | Match maturity to the holding period |
| Reinvestment risk | Short bills must be rolled at unknown future rates | Use zero-coupon or matched-maturity yields |
| Currency risk | A dollar rate is not risk-free for a euro investor | Use a rate in the currency of the cash flows |
| Liquidity risk | Off-the-run bonds trade less often | Use on-the-run or fitted-curve yields |
Default risk is now a live adjustment. In his 2026 data update on country risk, Damodaran calculated a US dollar risk-free rate of 3.95%, the 4.18% Treasury bond rate at the start of the year minus a 0.23% default spread for the Aa1 rating. He described this as a change from his practice before May 2025.
Kroll raised the same doubt in January. Its January 2026 executive summary asked whether Treasury yields remain a reasonable proxy for the US risk-free rate, citing dollar depreciation and trade policy volatility in 2025. We still use Treasuries, but we note the chosen proxy and any adjustment in every valuation memo.
Inflation risk matters most for long-horizon planning. The difference between the 10-year nominal yield and the 10-year TIPS yield, 5.17% minus 2.83%, gives market-implied inflation of about 2.3%. A return above the nominal rate can still be negative in real terms if inflation runs higher.
Interest rate risk affects holders who sell before maturity. A 20-year bond bought at 4.5% loses value when yields rise to 5.5%, even though it never defaults; our guide on how institutions manage interest rate risk covers the hedging side. Default risk on other borrowers is a separate topic, covered in our note on counterparty risk.
Inflation-indexed Treasuries remove most inflation risk. TreasuryDirect explains that TIPS principal rises with the consumer price index, so the yield is a real return. That makes TIPS the closest observable proxy for a real risk-free rate, although their market is smaller and less liquid than nominal Treasuries.
Which Rate to Use: Bills, Notes, Bonds, TIPS, or SOFR
The right proxy depends on the horizon and the inflation basis of the cash flows. The US Treasury’s daily par yield curve gives every maturity from one month to 30 years, and its real yield curve gives TIPS yields from five years out. The table sets out the choices we recommend.
| Use case | Proxy | Rate on Sep 25, 2026 | Reason |
| Sharpe ratio, money market returns | 3-month bill | 4.24% | Matches short holding periods |
| Project NPV over 5 to 10 years | 10-year note | 5.17% | Common market benchmark with deep liquidity |
| Business valuation, cost of equity | 20-year bond | 5.54% | Kroll guidance since September 2, 2026 |
| Real cash flow models | 10-year TIPS | 2.83% | Removes expected inflation |
| Derivatives discounting, floating loans | SOFR | 3.88% (Sep 24) | Overnight Treasury repo rate |
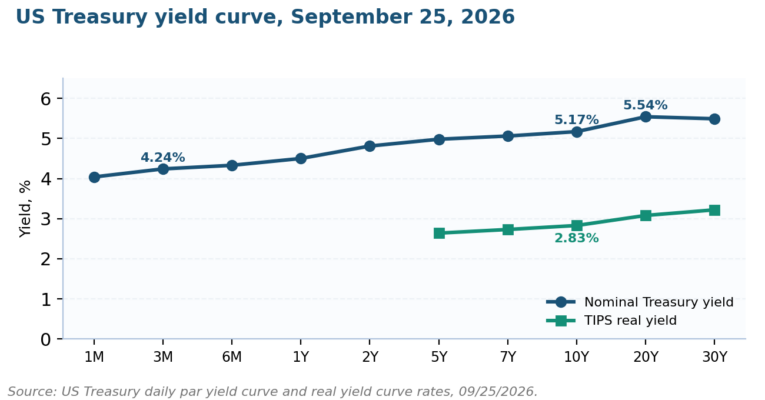
The curve rises from 4.04% at one month to 5.54% at 20 years, so the maturity you choose changes the risk-free rate by 1.5 points.
For long-lived assets, the 10-year versus 20-year choice matters: on September 25, 2026 the gap was 0.37 points. Kroll’s cost of capital page sets out each guidance period and its effective date. The 20-year is closer to the long duration of equity cash flows, although many corporate finance teams still use the 10-year for consistency with past analyses.
Short and long rates can move in opposite directions. In 2023 the 3-month bill averaged 5.28% while the 10-year averaged 3.96%, an inverted curve; by 2026 the long end sat above the short end again. A model that swaps between the two without saying so can shift value by a large amount.
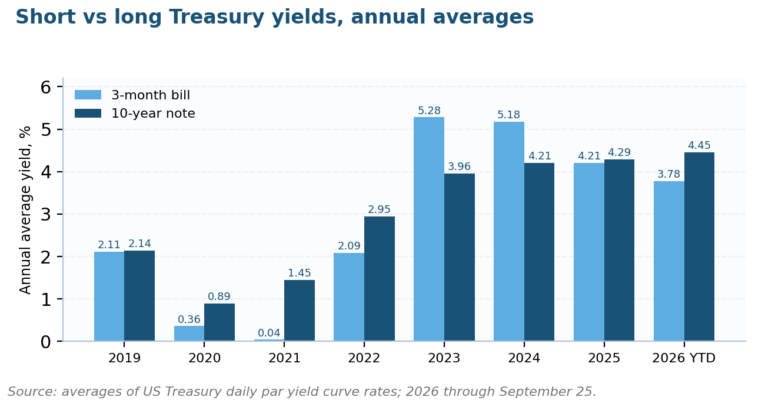
Bills yielded more than 10-year notes in 2023 and 2024, then fell below them as the Fed cut in late 2025.
How to Calculate and Apply the Risk-Free Rate
Calculating the risk-free rate usually means reading a published yield and making two adjustments. First convert between nominal and real terms if the cash flows require it, and second remove any default spread if you follow Damodaran’s method. The steps below take the rate from the Treasury page to a finished cost of equity.
- Pick the maturity that matches the cash flows and note the valuation date
- Read the yield from the Treasury par yield curve for that date
- Convert to a real rate with TIPS or the Fisher relation if the cash flows are in real terms
- Subtract a sovereign default spread if your method requires a pure default-free rate
- Add beta times the equity risk premium to reach the cost of equity
- Record the source, date, and adjustments in the valuation file
The Fisher relation links the two, and the St Louis Fed’s Monetary Trends states it as nominal rate equals real rate plus expected inflation. In exact form, 1.0517 divided by 1.0283 minus one gives implied inflation of 2.28% from the September 25 nominal and TIPS yields.
Now the CAPM step. With the 20-year yield of 5.54%, a beta of 1.2, and Kroll’s 5.0% premium, the cost of equity is 5.54% + 1.2 x 5.0% = 11.54%. Using the 3-month bill instead gives 10.24%, and the old 3.5% normalized rate would give 9.50%.
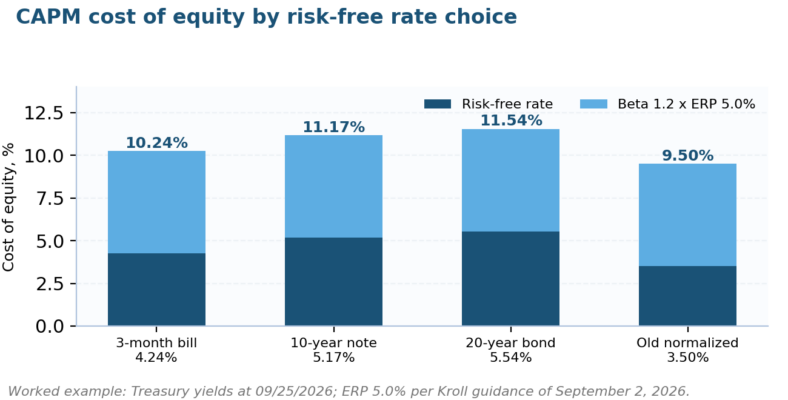
Same company, same beta, same premium: the risk-free rate choice alone moves the cost of equity by up to two points.
| Worked example: $10 million cash flow growing 2% | Risk-free rate | Cost of equity | Value |
| 20-year Treasury (Kroll, Sep 2026) | 5.54% | 11.54% | $104.8 million |
| 10-year Treasury | 5.17% | 11.17% | $109.1 million |
| 3-month bill | 4.24% | 10.24% | $121.4 million |
| Old normalized rate | 3.50% | 9.50% | $133.3 million |
The value spread is wide: $104.8 million to $133.3 million for the same business. That is why auditors and courts ask how the risk-free rate was chosen. Our financial risk assessment guide and the article on risk assessment for investments show where this input sits in a full review.
The Sharpe ratio uses the short rate. A portfolio returning 9% with 15% volatility has a Sharpe ratio of (9% minus 4.24%) divided by 15%, or 0.32. Our Monte Carlo simulation template and the pension fund Monte Carlo guide use the same input when projecting returns.
Rates Outside the US and Below Zero
Each currency has its own risk-free rate, and the yield on a government bond includes that government’s default risk. Damodaran’s country risk premium table, updated January 5, 2026, gives default spreads by rating: 0.00% for Aaa Germany, 0.51% for Aa3 United Kingdom, 0.60% for A1 Japan, and 1.62% for Baa2 Italy.
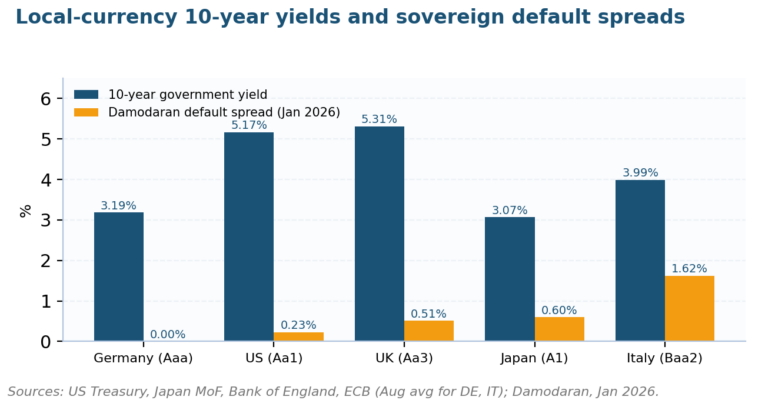
A local risk-free rate is the government yield minus its default spread. Italy’s spread is seven times the US figure.
| Country | 10-year yield | Default spread (Jan 2026) | Approximate local risk-free rate |
| Germany | 3.19% (Aug avg) | 0.00% | 3.19% |
| United States | 5.17% (Sep 25) | 0.23% | 4.94% |
| United Kingdom | 5.31% (Sep 23) | 0.51% | 4.80% |
| Japan | 3.07% (Sep 25) | 0.60% | 2.47% |
| Italy | 3.99% (Aug avg) | 1.62% | 2.37% |
Rates can also fall below zero. The European Central Bank held its deposit rate at minus 0.50% from September 2019 until July 2022, and its key rates page shows it at 2.00% since June 2025. The Bank of Japan ended negative rates on March 19, 2024.
The Swiss National Bank cut its policy rate to 0% in June 2025. A zero or negative risk-free rate still works in CAPM, but check that growth assumptions stay below the discount rate and that the equity premium was estimated on a consistent basis. Our guide to country risk indicators covers the sovereign side.
From LIBOR to SOFR: The Overnight Risk-Free Rates
Loans and derivatives now reference overnight rates built from actual transactions. The FCA confirms that the last synthetic US dollar LIBOR settings were published on September 30, 2024, and the Bank of England marked the end of all LIBOR panels that year. The old article’s mention of LIBOR as a risk-free rate is now out of date.
The Alternative Reference Rates Committee, which the New York Fed convened, chose SOFR as the dollar replacement. The New York Fed describes SOFR as a broad measure of the cost of borrowing cash overnight against Treasury collateral. On September 24, 2026 its published SOFR was 3.88%.
| Rate | Currency | Type | Administrator |
| SOFR | US dollar | Secured, Treasury repo | Federal Reserve Bank of New York |
| SONIA | Sterling | Unsecured, overnight | Bank of England |
| €STR | Euro | Unsecured, overnight | European Central Bank |
| TONA | Japanese yen | Unsecured, overnight | Bank of Japan |
| SARON | Swiss franc | Secured, repo | SIX Swiss Exchange |
The Financial Stability Board’s overview of overnight risk-free rates lists the same five benchmarks. These overnight rates price floating debt and derivatives; long-term valuations still use government bond yields. Our guide to basis risk explains what happens when the two move apart.
Risk-Free Rate: Your Questions Answered
What is the current risk-free rate in the US?
On September 25, 2026 the US risk-free rate was 4.24% on the 3-month Treasury bill, 5.17% on the 10-year note, and 5.54% on the 20-year bond. Which one counts as the risk-free rate depends on your horizon: short bills for short periods, long bonds for valuations.
Is the 10-year Treasury the risk-free rate?
The 10-year Treasury yield is the most widely quoted risk-free rate proxy for long-term US valuations. Kroll now recommends the 20-year yield for cost of capital, and short-horizon uses such as the Sharpe ratio take the 3-month bill. State your choice and keep it consistent.
How do you calculate the real risk-free rate?
Read the real risk-free rate directly from TIPS yields, or apply the Fisher relation: (1 + nominal rate) divided by (1 + expected inflation), minus one. On September 25, 2026 the 10-year TIPS yield was 2.83%, compared with a 5.17% nominal yield.
Can the risk-free rate be negative?
Yes, the risk-free rate can be negative when central banks set policy rates below zero. The European Central Bank held its deposit rate at minus 0.50% from 2019 to 2022, and Japan kept negative rates until March 2024. Negative rates still work in CAPM with consistent inputs.
Why is the risk-free rate important in CAPM?
The risk-free rate is the starting point of CAPM: cost of equity equals the risk-free rate plus beta times the equity risk premium. A one-point change in the risk-free rate moves the cost of equity by one point, which can change a company’s value by 10% or more.
Is SOFR a risk-free rate?
SOFR is the overnight risk-free rate for US dollar loans and derivatives, based on Treasury repo transactions. It replaced LIBOR, which ended in 2024. It is not a substitute for long Treasury yields in business valuation, because it covers one day, not the life of the cash flows.
Where Valuation Teams Go Wrong
Most errors with the risk-free rate are inconsistencies, not wrong numbers. They come from mixing currencies, horizons, or inflation bases, and they are simple to catch in review. The table lists the six we find most often and the fix for each, drawn from the standards above.
| Mistake | Effect | Fix |
| Using a stale rate | Discount rate off by a point or more after a move like 2026’s | Take the yield on the valuation date and cite it |
| Mixing nominal and real | Real cash flows discounted at a nominal rate understate value | Match TIPS to real flows, Treasuries to nominal |
| Wrong maturity | 3-month rate used for a 20-year asset | Match maturity to cash flow timing |
| Wrong currency | Dollar rate applied to euro cash flows | Use the risk-free rate of the cash-flow currency |
| Double-counting default | Country premium added on top of a yield that already includes it | Remove the default spread once |
| Old benchmark | LIBOR still referenced in models | Replace with SOFR or a term SOFR rate |
Many of these errors appear when models pass between teams. A treasury team may use SOFR, the valuation team the 20-year bond, and the risk team a 10-year curve. Our guides to liquidity risk KRIs and credit risk KRIs show where each rate belongs.
Where the Profession Is Heading
Expect more debate about whether the US Treasury rate is default-free. Damodaran’s adjustment and Kroll’s January question both reflect the Aa1 rating and the dollar’s 2025 decline. Firms that value cross-border assets should document how they treat the US default spread, even if they choose not to deduct it.
Rate levels have changed the practical question. When long yields were near 1%, normalization mattered; with the 20-year above 5.5%, spot yields are the default and small maturity choices move values. Revisit the risk-free input every quarter, and after every Fed decision that moves the curve.
For risk managers, the risk-free rate is also a planning input. It sets hurdle rates for capital projects, discount rates for loss models, and the baseline for our risk appetite and capacity work. Teams building finance careers can study it through the FRM or PRM syllabus.
The same input flows into project and risk models outside finance teams. Hurdle rates for infrastructure investment risk assessments, loss discounting in cyber risk quantification, and capital planning under Basel operational risk rules all start from a risk-free rate, so a change in the curve should trigger a review of each.
If your valuation or capital model still uses an old normalized rate or LIBOR, we can review the inputs and set a documented method for the risk-free rate, premium, and adjustments. See our risk and valuation advisory services, then send us the model and we will return a marked-up input sheet.

Chris Ekai is a Risk Management expert with over 10 years of experience in the field. He has a Master’s(MSc) degree in Risk Management from University of Portsmouth and is a CPA and Finance professional. He currently works as a Content Manager at Risk Publishing, writing about Enterprise Risk Management, Business Continuity Management and Project Management.