
Integrated risk management is the practice of running one risk taxonomy, one scoring scale and one register across every risk domain in a company, so exposures can be added together instead of compared by hand. It is an operating model layered onto enterprise risk management, and it is not a product you buy.
On 3 August 2026 the Financial Crimes Enforcement Network assessed a penalty it called historic: $125 million against UBS Financial Services for recidivist Bank Secrecy Act violations. FINRA added $20 million the same day, and the CFTC added $8 million.
The mechanism is what risk leaders should read twice. UBS installed an automated transaction monitoring tool in February 2021 which, in FINRA’s words, omitted a significant percentage of the firm’s activity because of an incomplete data file and a labeling change.
The gap came to roughly 33% of foreign currency wires in retail customer accounts. Nobody at the firm chose to stop monitoring a third of that traffic. A handoff between two systems dropped the records quietly, and the control carried on reporting green to everyone above it.
FinCEN found something sharper still. UBS failed to act on negative news about customers, it wrote, even when one of the firm’s own affiliates expressed concerns about that news. The knowledge existed inside the group and never reached the people deciding.
What Integrated Risk Management Actually Joins
Most definitions of this term describe an ambition and skip the mechanism entirely. The useful definition is narrow: integrated risk management is the wiring that lets separate risk disciplines share one language, one scale and one set of records, so that a board sees a portfolio instead of a stack of departmental reports.
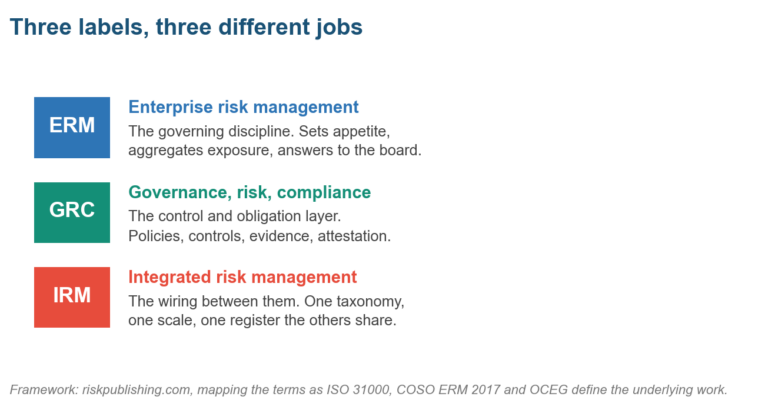
Figure 1. The three labels do different jobs. Confusing them is why so many programs buy a platform and change nothing.
Enterprise risk management is the governing discipline that sets appetite and answers to the board. Governance, risk and compliance is the control and obligation layer underneath it. Integration is the plumbing that makes those two layers describe the same company in the same words.
|
|
ERM |
GRC |
Integration |
|
Primary question |
How much risk are we willing to carry? |
Are our controls working and evidenced? |
Do our answers reconcile across functions? |
|
Main output |
Appetite, tolerances, board reporting |
Policies, control tests, attestations |
One taxonomy, one scale, one register |
|
Typical owner |
Chief risk officer or the board committee |
Compliance and control functions |
Whoever owns the risk data model |
|
Fails when |
Appetite is written and never cascaded |
Controls are tested but never aggregated |
Each function keeps its own private scale |
|
Buy or build |
Build. It is a governance choice. |
Partly buy. Tooling helps evidence. |
Build first. Tooling only scales what exists. |
Table 1. How the three terms divide the work, and the failure mode specific to each.
Our guides to enterprise risk management and the GRC framework go deeper on each layer. The distinction matters commercially as well as intellectually, because vendors will happily sell you all three of them under whichever label the buyer happened to use in the first meeting.
The analyst who named it has quietly stopped using it
Gartner popularized this term and then walked away from it, which almost no guide mentions. Its glossary entry now reads that Gartner no longer recognizes IRM as a market and that future work from its analysts will no longer reference it as such.
That entry is itself hard to reach. The glossary URL redirects to a hub page as of August 2026, and the sentence survives in an archived snapshot from November 2025. Gartner also moved its comparison research to governance, risk and compliance tools for assurance leaders in October 2025.
Yet the buyer-facing side never got the message. Gartner Peer Insights still runs a live Integrated Risk Management Solutions market in 2026, listing more than a hundred products against a Gartner-authored definition. The analysts retired the category and the buyers kept the word.
A practitioner should find that liberating. If the market label itself is contested, nobody can sell you the category, and the only test left standing is whether your own registers reconcile. That is a question about your own data, not about a vendor’s quadrant position.
How Far Most Programs Get Before They Stall
Definitions are cheap, so it helps to look at what companies have really built. The NC State ERM Initiative and AICPA & CIMA survey 273 US organizations each year, and the resulting picture is not one of quiet competence in most of them.
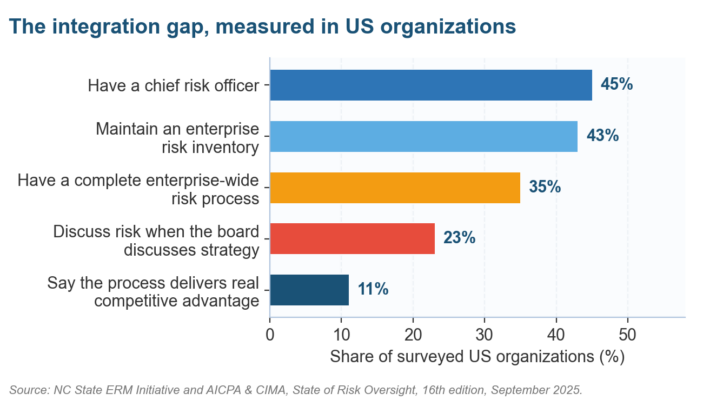
Figure 2. The gap is widest at the bottom of the chart, where risk work is supposed to change a decision.
Read the bottom two bars together. Only 23% of these organizations discuss risk when the board discusses strategy, and only 11% say the process delivers real competitive advantage, according to the 16th edition of the State of Risk Oversight published in September 2025.
A separate KPMG survey of 851 organizations found that just 18% run third-party risk fully integrated with enterprise risk management. That is the single most quotable number in this field, because third-party risk is the domain most companies claim to have joined up already, as the 2026 third-party risk survey sets out.
The barriers are consistent. KPMG’s survey of 208 US C-suite leaders found 71% naming the absence of an integrated view of risks as an obstacle, and the same share reporting duplicated effort across functions, in its risk and resilience research of March 2025.
Rather than argue about whether a program counts as mature, it is quicker to locate it on the ladder below. Each stage is defined by an artifact somebody outside the risk function could ask to see, which keeps the self-assessment honest.
|
Stage |
What you would see |
The next move |
|
Fragmented |
Each function keeps its own register, its own scale and its own definition of a high risk. |
Agree one taxonomy and map the existing registers onto it before touching anything else. |
|
Aligned names |
A shared taxonomy exists, but scoring bands are still interpreted locally by each team. |
Anchor every band to observable evidence and test the wording across two functions. |
|
Comparable |
Scores mean the same thing everywhere, and consolidation still takes days of manual work. |
Automate the consolidation so the portfolio view regenerates from source records. |
|
Aggregated |
A board view is produced from source data with a documented reconciliation behind it. |
Wire event triggers so incidents reopen assessments across domains automatically. |
|
Responsive |
An event in one domain visibly moves scores in another, and the log proves it happened. |
Assign standing ownership of the risk data model so integrated risk management does not decay. |
Table 2. A five-stage ladder for integrated risk management, defined by the artifact each stage has to produce.
Four Tests of Integrated Risk Management
Plenty of companies believe they are integrated because their risk functions share a folder and meet quarterly. Four tests separate that from the real thing, and each one can be checked in a single afternoon without buying anything or hiring anyone.
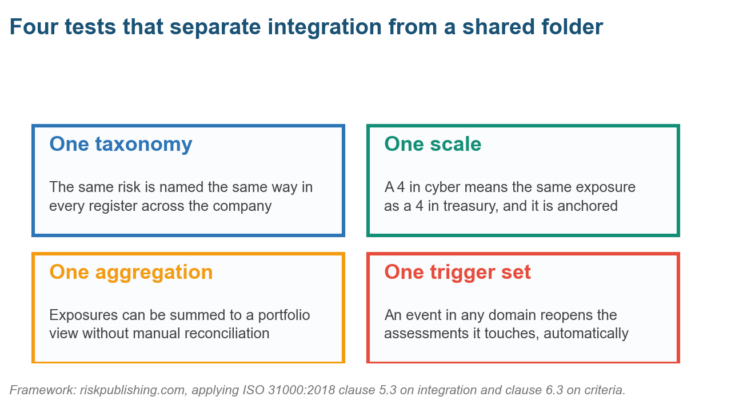
Figure 3. Four questions to put to your own registers. Failing any one of them means the exposures cannot be added up honestly.
The scale test is the one that catches most programs. If a 4 in the cyber register describes a different magnitude than a 4 in treasury, no aggregation of the two is meaningful, which is why our comparison of 5×5 and 4×4 scoring spends so long on band anchoring.
The aggregation test is the one boards notice. If producing a portfolio view takes an analyst three days of manual reconciliation each quarter, the company does not have an integrated position. It has a spreadsheet somebody rebuilds under deadline, which is where board-ready dashboards usually go wrong.
Trigger design decides whether the integration survives its first contact with real events. A confirmed incident in one domain should reopen the assessments it touches everywhere else, and defining those triggers is part of building a usable risk register rather than an archive nobody ever reopens.
The Seams Where Risk Data Has to Cross
Integration failures are rarely spread evenly across a company. They concentrate at seams, meaning the specific handoffs where one function’s output becomes another function’s input, and filings from the first seven months of 2026 show four of those seams giving way.
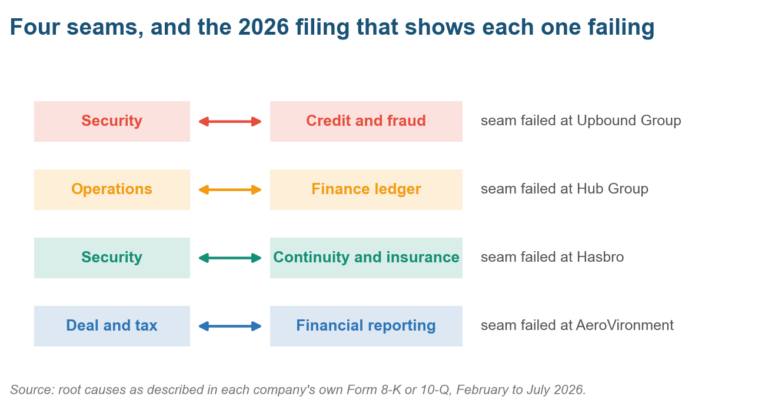
Figure 4. Each seam is a pair of functions that had to exchange data. Each one is named in the company’s own filing.
Hub Group is the clearest case of the four, because the fragmentation was the cause and not merely a consequence. Transport costs generated in operating systems never reconciled into the finance ledger, producing a $77 million correction that the company disclosed on 5 February 2026.
By May of this year the consequence had grown considerably. The company reported that two audited years should no longer be relied upon and that it expected to conclude it did not maintain effective internal control over financial reporting for either of them.
Upbound Group shows the same shape in a different pair of functions. Documents taken in a cybersecurity incident were used to open lease agreements, contributing roughly $13 million in fraud losses in one quarter because security signals never reached the underwriting decision.
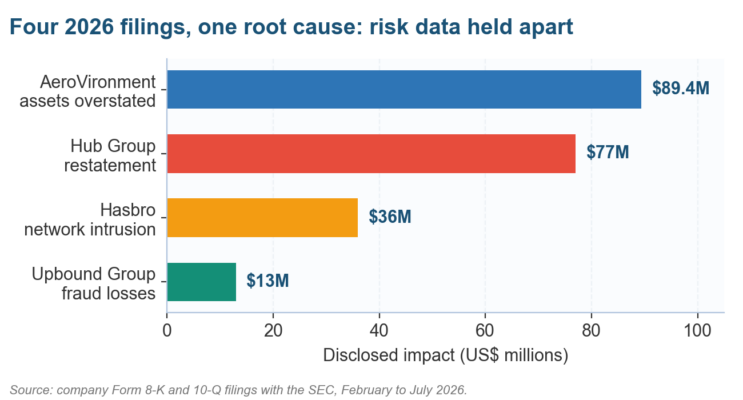
Figure 5. Four disclosures, February to July 2026. The Hasbro bar combines $11m of direct cost with a $25m revenue impact.
The pattern holds outside financial services, which matters because the sector often assumes these are banking problems. Manufacturing, logistics, consumer goods and defense all appear in this short list, and none of the four failures required a sophisticated attacker or an unforeseeable event.
Building the Wiring in Five Moves
The build sequence matters more than the tooling, and the order below is deliberate. Every move produces an artifact somebody outside the risk function can inspect, which is the only reliable defense against a program that reports progress without producing any.
|
Move |
What the move involves |
The artifact it produces |
Realistic time |
|
1. Taxonomy |
Agree one naming scheme for risks across every function, then map each existing register onto it. |
A published taxonomy plus a mapping table showing where each old label now sits. |
6 to 10 weeks |
|
2. Scale |
Anchor every band to something observable, and force cyber, finance and operations onto the same definitions. |
A scoring standard with worked examples per band, signed off by each function. |
4 to 8 weeks |
|
3. Ownership |
Name an accountable owner for each risk in the taxonomy, not a committee and not a department. |
An ownership register that survives a reorganization because it names roles. |
3 to 6 weeks |
|
4. Aggregation |
Consolidate registers into one store and produce the portfolio view without manual rework. |
A repeatable board view generated from source data, plus its reconciliation. |
8 to 16 weeks |
|
5. Triggers |
Define the events that reopen assessments, and wire them to the register rather than the calendar. |
A trigger catalog with logged reassessments showing which score moved and why. |
Ongoing |
Table 3. Five moves in sequence. Skipping to move four is the most common and most expensive mistake.
Notice that technology appears nowhere until move four. A platform bought before the taxonomy exists will encode the silos it was meant to remove, which is why our comparison of ERM platforms treats data model flexibility as the deciding criterion.
The appetite cascade belongs alongside move three and is usually forgotten there. A group-level appetite statement that never becomes unit-level tolerances leaves front-line managers guessing, and our collection of risk appetite statements shows what a properly cascaded version reads like in practice.
What the Standards Now Say
This is where most published guidance on the topic has gone stale, and one item in particular is widely reported wrongly. The standards that govern integration have moved considerably in the last twelve months, and three of those movements are easy to check yourself.
|
Standard or guidance |
Status in August 2026 |
Why it matters for integration |
|
ISO 31000:2018 |
In force, but under revision. The systematic review closed in October 2024 with a decision to revise, and a committee draft for a third edition is in development. |
Clause 5.3 is the integration clause. Guidance still claiming no revision is planned is out of date. |
|
COSO ERM 2017 |
Current edition, no replacement announced. New board oversight guidance issued 31 March 2026. |
Still the reference for tying risk to strategy and performance rather than to a control list. |
|
NIST IR 8286 Rev. 1 |
Revision 1 finalized in December 2025, superseding the 2020 original. |
The most directly on-point government document: how to fold cyber risk into enterprise risk. |
|
NIST CSF 2.0 |
Released February 2024, unchanged. Added GOVERN as a sixth function. |
GOVERN is the hook that connects a cyber program to enterprise governance. |
|
ISO/IEC 42001:2023 |
In force. The AI management system standard. |
The natural integration point for AI risk, and the one competitors leave out. |
|
OCC Bulletin 2026-13 |
Issued 17 April 2026 with Federal Reserve SR 26-2 and FDIC FIL-15-2026. Rescinds SR 11-7 and SR 21-8. |
Carries a dedicated section on vendor and other third-party products, for banks above $30 billion in assets. |
Table 4. The standards position as at August 2026, with the revision status most guidance still gets wrong.
The ISO point deserves particular emphasis, because anyone can check it in about a minute. The ISO 31000 record shows the 2018 edition, while the committee draft for the next edition is listed as under development and set to replace it.
For banks the model risk rules changed materially this year. OCC Bulletin 2026-13 replaced the 2011 guidance that our SR 11-7 explainer describes, and it now carries a dedicated section on vendor and other third-party products in the same document.
On the technology side the two frameworks worth wiring together are the Cybersecurity Framework and NIST IR 8286 Revision 1. Our comparison of NIST CSF and ISO 27001 covers which of the two to anchor an enterprise control library on.
Integration Became a Disclosure Obligation
Something changed in 2023 that most guidance on this topic still omits entirely. Integration stopped being only good practice for US public companies and became a line item in federal securities law, with company officers signing whatever description they give of it.
Regulation S-K Item 106 requires a registrant to describe its processes for managing material cybersecurity risks and, in the rule’s own words, whether and how any such processes have been integrated into the registrant’s overall risk management system or processes.
That wording rewards companies that can answer plainly and exposes those that cannot. A filer with four disconnected registers has to describe the connection in a document signed by its officers, which is a harder place to be vague than a management pack.
|
Obligation |
Who it binds and when |
The integration it assumes |
|
SEC Reg S-K Item 106 |
US registrants, in force since 2023 and unamended. |
Cyber risk processes described in relation to the enterprise risk system, not in isolation. |
|
SEC Form 8-K Item 1.05 |
US registrants, four business days after a materiality determination. |
Security, legal, finance and disclosure functions reaching one judgment on one clock. |
|
DORA |
EU financial entities, applicable since 17 January 2025. |
One register of information covering every ICT third-party arrangement in the group. |
|
EU AI Act |
Transparency duties and enforcement live 2 August 2026. High-risk duties deferred to December 2027 and August 2028. |
AI risk assessed inside the existing risk framework, never in a parallel one. |
|
CSRD, as amended |
EU undertakings above 450m euro turnover and 1,000 employees, for financial years from 1 January 2027. |
Sustainability data governed to the same standard as financial data. |
Table 5. Five obligations that assume integration. Each one is harder to satisfy from separate registers.
The AI timetable is the one most commonly misreported. Transparency obligations and national enforcement did start on 2 August 2026, but the high-risk regime was deferred to December 2027 and August 2028, a distinction our EU AI Act and NIST AI RMF comparison sets out.
For firms inside scope of the EU operational resilience regime, the register of information is the clearest test of whether integration exists on paper only. Our guide to DORA and NIS2 covers what that register has to contain and who has to sign it off.
Internal Audit Is Now the Integrator of Assurance
The most useful development this year came from the assurance side, and it is five weeks old at the time of writing. On 8 July 2026 the Institute of Internal Auditors replaced its 2020 Three Lines Model with a Statement of Position.
The document names the underlying problem more directly than its predecessor did. Rather than operating in silos, it says, assurance providers may align methodologies, share risk information and coordinate planning, and it calls the structured version of this integrated assurance.
It also assigns the role. Internal audit is described as the integrator of assurance, which is a considerably more specific job than the coordination language of the old model, and it changes what a head of audit should be measured on.
- An assurance map showing which provider covers which risk, and where two providers duplicate each other for no reason.
- A shared risk taxonomy, so that audit findings and risk register entries describe the same exposures in the same words.
- Aligned reporting cycles, so the board is not comparing a risk report and an audit report drawn from different quarters.
- Coordinated planning discussions held before the audit plan is fixed, not after it has been approved.
This reframes the Three Lines conversation that our three lines explainer describes, and it makes the second and third lines jointly responsible for coverage. Practically, it also means control self-assessment output has to be usable by audit, which is the point of a disciplined RCSA process.
The Integrated Risk Management Questions Boards Keep Asking
What is integrated risk management in simple terms?
Integrated risk management is running one risk language across a whole company so that exposures can be added together. Every function names risks the same way, scores them on the same anchored scale, and files them in one register that a board can read as a portfolio instead of a pile of departmental reports.
How is integrated risk management different from ERM?
Enterprise risk management is the governing discipline that sets appetite and reports to the board. Integration is the wiring that makes it possible, meaning the shared taxonomy, scale and register. A company can have ERM on paper and no integration, which is the most common situation in practice.
Is integrated risk management the same as GRC?
No, and the difference shows up in practice quickly. Governance, risk and compliance is the control and obligation layer that evidences whether controls work, while integration is about whether the outputs of GRC, ERM and the operating functions reconcile with each other. GRC tooling can support integration, and buying it never creates integration on its own.
Did Gartner abandon integrated risk management as a category?
On the analyst side, yes. Gartner’s glossary states that it no longer recognizes IRM as a market and that its analysts will stop referencing it, and the comparison research moved to governance, risk and compliance tools for assurance leaders. Peer Insights still runs an IRM solutions market for buyers.
Do you need software for integrated risk management?
Not at the start, and buying early usually hurts. A platform purchased before the taxonomy and scoring standard exist will encode the silos it was meant to remove. Build moves one to three manually, then choose tooling to scale what already works rather than to invent it.
What does ISO 31000 say about integration?
Clause 5.3 of ISO 31000:2018 covers integration and places risk management inside the organization’s own governance, management and decision-making arrangements. Note that the standard is now being revised, with a committee draft for a third edition currently in development at ISO.
How do you measure whether integration is working?
Measure the reconciliation, not the activity. Track how long a portfolio view takes to produce, how many risks appear under different names in different registers, and how often an event in one domain triggers a documented reassessment in another. Those three numbers move only when integration is real.
Where should a company start if it has nothing?
Start with the taxonomy, because everything else depends on it. Take the three largest existing registers, list every risk name in each, and find where the same exposure carries three labels. That exercise takes about a week and usually settles any internal argument about whether integration is needed.
Where Integration Programs Break Down
The failures below appear in programs that comfortably pass every audit of their own documentation. Each one of them is baked into the design of the program, which is exactly why they survive round after round of process improvement completely untouched.
|
Failure |
How it shows up |
The correction |
|
Platform before taxonomy |
A tool is configured around existing departmental fields, so the silos are now encoded in software. |
Publish the taxonomy first and treat tool configuration as an implementation of it. |
|
Unanchored scales |
Each function scores honestly against a private idea of what a 4 means, so totals are meaningless. |
Anchor every band to observable evidence and test the definitions across two functions. |
|
Centralized data, decentralized nothing |
Risk data flows up, accountability does not flow down, and operators ignore the dashboard. |
Name an owner per risk with authority to act, not a committee that receives a report. |
|
Calendar-driven review |
Assessments refresh annually while events arrive weekly, so the register is stale most of the year. |
Define event triggers and log every trigger-linked reassessment against the register. |
|
Third-party risk left outside |
Vendor risk runs on its own scale and cannot be summed into the enterprise position. |
Bring third-party risk onto the enterprise taxonomy before extending it to fourth parties. |
|
Assurance duplication |
Two functions test the same control for different reports and neither relies on the other. |
Build an assurance map, then let internal audit act as the integrator the IIA now describes. |
|
Integration as a project |
A program closes, the integration lead moves on, and the taxonomy drifts within two cycles. |
Assign standing ownership of the risk data model, in the same way a chart of accounts is owned. |
Table 6. Seven recurring failures, each with the correction that costs least to make.
The first and third travel together most often. A platform arrives, dashboards improve, and nothing on the front line changes because no named person gained authority to act, which is the gap inherent and residual scoring is supposed to expose.
Third-party risk deserves particular attention given the direction of the evidence. Verizon’s 2026 breach report found third-party involvement in 48% of breaches, roughly double the share it reported a year earlier, which makes vendor risk tooling and fourth-party exposure a first-order integration problem.
What Changes Between Now and 2028
The revision of ISO 31000 is the change with the longest reach. It will restate what integration means, and any program built on the 2018 clause structure should expect to re-map its documentation without rewriting the underlying process from scratch.
Assurance consolidation is already under way and will reach audit committees first. With internal audit named as the integrator, expect boards to ask which assurance provider covers which risk, and to notice when two functions test the same control for different reports.
AI risk arrives with a deadline attached to it. High-risk obligations under the EU regime start in December 2027, and the sensible move is to assess AI systems inside the existing framework using ISO/IEC 42001 and the NIST AI Risk Management Framework, as our AI governance guide describes.
Before booking a platform demonstration, run one test on your own records. Pick the last confirmed incident in any domain and trace whether it reopened a single assessment anywhere else in the company. If it did not, trigger design is your gap, and no tool will supply it.
If you are a risk or audit lead whose reports are thorough and rarely reconcile with each other, we help teams build the taxonomy, anchor the scales and produce a portfolio view that survives a board question. See how we work, or write to us with the two registers that disagree most.

Chris Ekai is a Risk Management expert with over 10 years of experience in the field. He has a Master’s(MSc) degree in Risk Management from University of Portsmouth and is a CPA and Finance professional. He currently works as a Content Manager at Risk Publishing, writing about Enterprise Risk Management, Business Continuity Management and Project Management.