
Risk attributes are the characteristics that describe a specific risk: how likely it is, how hard it hits, how fast it moves, how long it lasts, how much of it you control, and how early you can detect it. Registers record attributes per risk so scoring, treatment, and monitoring decisions rest on the full profile.
On September 10, 2023, a caller impersonating an MGM Resorts employee spent about ten minutes with the company’s IT help desk and walked away with reset credentials. Within hours, slot machines, room keys, and reservation systems across the Las Vegas Strip were failing, and the disruption ran ten days.
MGM booked roughly $100 million in lost third-quarter earnings plus about $10 million in one-time expenses, and CISA’s advisory on the Scattered Spider group turned the incident into required reading. On a classic 5×5 matrix, this risk looked ordinary before it fired.
| Risk Attributes: Key Takeaways |
| Risk attributes are the characteristics that describe a risk: likelihood, impact, velocity, persistence, controllability, and detectability, recorded per risk in the register. |
| A single likelihood x impact score hides the shape of a risk. MGM Resorts’ September 2023 attack scored like many others on paper, then moved from one phone call to casino-floor shutdown in hours and cost $100 million. |
| Anchor every scored attribute to observable bands: probability percentages for likelihood, dollar ranges for impact, and time-to-impact for velocity, in the NIST SP 800-30 style. |
| Only 30% of US organizations rate their risk oversight as mature, per NC State’s State of Risk Oversight research, and thin risk description is a common reason. |
| Investment analysis uses its own quantitative attribute set: volatility, beta, alpha, standard deviation, Sharpe ratio, and liquidity, each measuring one dimension of exposure. |
| Wire attributes to key risk indicators so the register updates from data: velocity and detectability decide monitoring frequency, controllability decides treatment strategy. |
What the matrix missed was velocity, the attribute measuring how fast a risk moves from trigger to impact. This guide takes each attribute in turn: what it describes, how to score it without false precision, and how the investment world’s quantitative versions follow the same logic.
What Risk Attributes Describe
Every risk in a register is a claim about the future, and attributes are the fields that make the claim specific. ISO 31000 and its vocabulary companion ISO Guide 73 define risk as the effect of uncertainty on objectives, which means a usable risk record must describe the uncertainty, the effect, and the objective.
Attributes split into two families. Descriptive attributes classify the risk: category, source, affected objective, and owner, the backbone of any well-built risk register. Analytical attributes measure it: likelihood, impact, velocity, persistence, controllability, and detectability, the fields that drive scoring and treatment.
The distinction matters because the two families answer different questions. Descriptive fields tell you where a risk lives and who answers for it, while analytical risk attributes tell you how scared to be and how quickly to act, which is why the key elements of a risk register always include both.
Why a Single Score Misleads
Most registers compress everything into likelihood times impact, and that compression loses information the way MGM discovered. Two risks can carry an identical score of 12 yet demand opposite management: one detonates in hours while the other builds quietly over years.
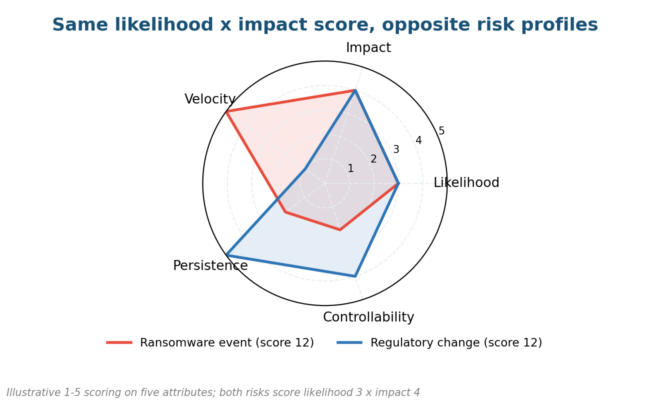
Figure 1. A ransomware event and a regulatory change both score 3 x 4, and the attribute profiles could hardly differ more.
COSO’s 2017 ERM framework made velocity explicit for exactly this reason, and the Institute of Risk Management treats it as core vocabulary. A fast, hard-to-detect risk needs pre-built response capacity, while a slow, controllable one rewards patient mitigation, a distinction a 5×5 score alone cannot draw.
The maturity data suggests most programs still run compressed. NC State’s State of Risk Oversight research finds only 30% of US organizations rate their risk oversight as mature, and just 37% claim complete ERM processes, per the AICPA’s summary of the same study. Thin risk description is one of the habits keeping those numbers low.
The Attribute Set a Working Register Carries
Moving from one score to a profile means adding fields, and the good news is that six analytical attributes cover most decisions. The table below defines each with the question it answers and a workable scale, aligned to ISO 31000 and PMBOK’s project risk practice.
| Attribute | Question it answers | Workable scale | Drives |
| Likelihood | How probable is the event this period? | 1-5 anchored to % bands | Score, assessment cadence |
| Impact | How badly does it hurt objectives? | 1-5 anchored to $ and service ranges | Score, treatment budget |
| Velocity | How fast from trigger to impact? | Years / months / weeks / days / hours | Response readiness |
| Persistence | How long does the impact last? | Transient / episodic / sustained / permanent | Recovery planning |
| Controllability | How much can we influence it? | High / partial / low / none | Treat vs accept vs transfer |
| Detectability | Will we see it coming? | Leading signal / concurrent / after the fact | KRI and monitoring design |
Project teams often add proximity, when the risk window opens, and urgency, how soon a response must start, both from the PMBOK tradition. Opportunity-side registers score the same fields on upside, which our guide to positive risk covers, since ISO 31000 defines effects in both directions.
Keep descriptive attributes disciplined too. A category from a fixed taxonomy, a named owner, the affected objective, and a cause-event-consequence statement make the record searchable and aggregatable, the structure a risk assessment methodology imposes and a free-text register never achieves.
How to Score Risk Attributes Without False Precision
A six-attribute record only helps if the scores mean something, and meaning comes from anchoring. NIST SP 800-30 models the practice: every qualitative level maps to a quantitative band, so two assessors reading the same evidence land on the same number. Pretrial instruments like the Nevada risk assessment tool run on identical anchoring discipline, as does the SARA risk assessment for intimate partner violence.
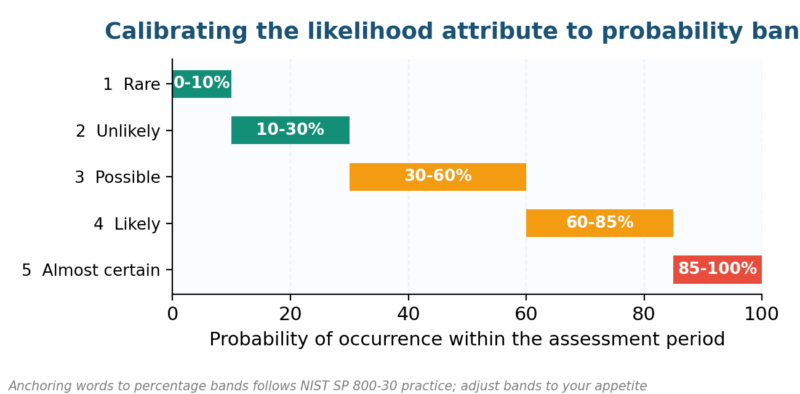
Figure 2. Words argue, bands settle: each likelihood level anchored to a probability range for the assessment period.
Apply the same discipline to every attribute you score. Our definition of likelihood walks through the calibration conversation, and the hazard versus risk distinction keeps assessors scoring the event, the thing that actually lands, rather than the hazard source. Four rules keep the exercise honest:
- Anchor every level: percentages for likelihood, dollar and service-hour ranges for impact, time-to-impact for velocity
- Score inherent and residual separately, so control effect is visible and testable
- Record the evidence behind each score in the register, one line per attribute
- Weight attributes deliberately when combining them; an unexamined average is a hidden decision
Quantitative programs push further. The FAIR taxonomy decomposes risk into loss event frequency and loss magnitude and runs Monte Carlo simulation over the ranges, producing loss distributions instead of cell colors, an approach McKinsey’s risk practice reports gaining ground in cyber and operational risk.
Whichever method you run, feed results back into a consistent grid. A risk matrix template or our free matrix generator gives the scored attributes a shared display, and the five-step risk process fixes where scoring sits in the wider management cycle.
Beta, Alpha, and the Investment Metrics Family
Investors solved attribute measurement decades before ERM did, because market data made it possible. The metrics below are quantitative risk attributes of a security or portfolio, each isolating one dimension of exposure, and Investor.gov’s risk tolerance guidance frames how they meet an individual’s appetite.
| Metric | What it measures | How to read it |
| Volatility | How widely price swings over time | Higher swings mean a rougher ride and fatter tails |
| Beta | Sensitivity to the whole market’s moves | 1.0 tracks the market; above 1.0 amplifies it; below dampens |
| Alpha | Return beyond the benchmark’s explanation | Positive alpha is outperformance after risk adjustment |
| Standard deviation | Dispersion of returns around the average | The wider the spread, the less the average tells you |
| Sharpe ratio | Excess return earned per unit of volatility | Higher is better; below ~1.0 the risk is poorly paid |
| Liquidity | How quickly the position converts to cash | Thin markets turn exits into losses under stress |
Notice the same logic as the register: no single metric decides. A fund can post handsome alpha with terrifying volatility, exactly the way a corporate risk can score a modest 12 while carrying hours-level velocity, and CFA Institute curricula teach the metrics as a set for that reason.
Systematic and unsystematic risk complete the picture. Market-wide risk resists diversification and gets managed through allocation, while company-specific risk diversifies away, a split that mirrors how an enterprise risk framework separates external environment risks from ones the organization can engineer down.
Wiring the Scores Into Monitoring
Attributes earn their space when they change behavior between assessments. Detectability and velocity together set monitoring design: a fast, low-detectability risk needs key risk indicators sampled weekly with automated alerts, while a slow, visible one can live on a quarterly review, cadence logic our guide to assessment frequency formalizes.
| Attribute signal | Monitoring response | Example |
| High velocity + low detectability | Automated KRIs, pre-authorized response | Help-desk credential resets logged and alerted in real time |
| High velocity + good detectability | Leading KRIs with trigger thresholds | Days of supply cover tracked against a floor |
| Low velocity + high persistence | Quarterly indicator review | Regulatory pipeline tracking with owner sign-off |
| Low controllability | Transfer or contingency emphasis | Insurance limits reviewed against impact bands |
| Falling detectability | Escalate to risk committee | Vendor stops sharing incident data |
Building the indicator layer is its own craft: developing KRIs that actually predict ties each indicator to a scored attribute, the best key risk indicators lean toward leading signals, and a risk dashboard puts attribute movement in front of decision-makers monthly.
Aggregate views close the loop. A heat map plots the classic two attributes, supply chain teams track indicator sets per critical supplier, and appetite statements set the thresholds, since a score only matters against a stated risk appetite.
The Risk Attributes Questions Boards and Executives Keep Asking
What are risk attributes in risk management?
Risk attributes are the recorded characteristics of an individual risk: descriptive fields like category, owner, and affected objective, plus analytical fields like likelihood, impact, velocity, persistence, controllability, and detectability. Together they turn a one-line worry into a record that supports scoring, treatment choice, and monitoring design.
What is the difference between qualitative and quantitative risk attributes?
Qualitative risk attributes use judgment scales, such as a 1-5 likelihood rating or a high-partial-low controllability call. Quantitative risk attributes use measured values: probability percentages, dollar loss distributions, beta, or standard deviation. Mature programs anchor qualitative scales to quantitative bands so the two converge on the same answer.
Which risk attributes belong in a risk register?
Carry at minimum: risk ID, category, cause-event-consequence description, owner, likelihood, impact, inherent and residual scores, and treatment status. Add velocity, persistence, controllability, and detectability for risks rated above appetite, since those four decide response readiness and monitoring frequency where the basic score cannot.
How do risk attributes affect a risk score?
Likelihood and impact multiply into the headline score, and any weighting applied to other attributes shifts ranking beneath it. A velocity or detectability weighting can promote a fast, hard-to-see risk above a slower one with the same base score, which is precisely the adjustment MGM’s September 2023 experience argues for.
What are examples of investment risk attributes?
The standard set: volatility and standard deviation for return dispersion, beta for market sensitivity, alpha for risk-adjusted outperformance, the Sharpe ratio for return earned per unit of risk, and liquidity for exit speed. Read them together; any single metric in isolation flatters some funds and slanders others.
How often should risk attributes be reviewed?
Re-score analytical attributes at every scheduled assessment, quarterly for most corporate registers, and immediately after any incident, near miss, control failure, or major business change. Velocity and detectability deserve special attention at review, because control and threat changes move them faster than likelihood drifts.
Traps That Derail the Scoring Exercise
Attribute frameworks fail in recognizable ways, and most failures trace to design shortcuts rather than assessor skill. The table below pairs the six we meet most often in register reviews with corrections that hold up, each applied on real engagements.
| Pitfall | Root cause | Remedy |
| Unanchored scales | Levels defined by adjectives alone | Map every level to a % band, $ range, or time window |
| Attribute sprawl | Fifteen fields nobody maintains | Six analytical fields, and only above-appetite risks get all six |
| Same score, same treatment | Velocity and controllability ignored | Route treatment strategy off the full profile |
| Inherent-only scoring | Controls invisible in the record | Score residual separately; test the gap |
| Stale scores | Annual-only review cycle | Re-score on incidents and KRI breaches, not just calendar |
| Averaging away the signal | Unweighted composite scores | Weight deliberately and document the weights |
Where Risk Description Is Heading
Expect three shifts through 2027. Quantification keeps spreading beyond finance: FAIR-style loss modeling is becoming a board expectation in cyber, and simulation over attribute ranges is replacing single-point scores in operational risk at larger US firms and at their insurers.
Velocity earns register real estate next. The pattern behind MGM, and behind the social engineering statistics Verizon’s DBIR tracks year after year, is trigger-to-impact windows collapsing from weeks to hours, which makes response readiness a scored attribute rather than an aspiration.
Detection is the third front. As NIST’s Cybersecurity Framework pushes detect-and-respond maturity, detectability scoring will link registers directly to monitoring investment, and risk attributes will drive budget lines the way impact bands already drive insurance limits at every annual renewal.
If your register still describes every risk with two numbers, the risk assessment pillar guide and a scenario-based assessment are the fastest upgrades. For a register rebuild with calibrated attributes and working KRIs, review our services and send your current template through the contact page; we will mark up the gaps on the first pass.

Chris Ekai is a Risk Management expert with over 10 years of experience in the field. He has a Master’s(MSc) degree in Risk Management from University of Portsmouth and is a CPA and Finance professional. He currently works as a Content Manager at Risk Publishing, writing about Enterprise Risk Management, Business Continuity Management and Project Management.