Risk analysis and management of petroleum exploration ventures is the discipline of quantifying each prospect’s chance of geological success, converting it into expected monetary value, and managing a portfolio of such bets alongside technical, commercial, HSE, and political risks. Its standard method comes from Peter Rose’s AAPG framework, wrapped today in ISO 31000 governance.
On July 18, 2025, Chevron closed its $53 billion acquisition of Hess after an ICC tribunal rejected ExxonMobil’s claimed right of first refusal, a dispute analyzed closely by joint-venture lawyers because the prize was singular: Hess’s 30 percent of Guyana’s Stabroek block and its 11 billion barrels of discovered resource.
| Risk Analysis and Management of Petroleum Exploration: Key Takeaways |
| Exploration is a discipline of priced failure: only 31% of the 64 high-impact wells drilled in 2025 succeeded commercially (Westwood), and those 64 wells were the fewest since 2008. |
| Geological chance of success multiplies four factors (source and charge, reservoir, trap, seal); four reasonable probabilities of 0.60-0.80 compound to a one-in-four prospect. |
| Expected monetary value converts probability into a rankable number: EMV = POS x success-case NPV minus (1 – POS) x dry-hole cost. Portfolios, not single wells, are the unit of management. |
| Discovery is not commerciality: Shell wrote down $400 million on Namibia’s PEL 39 in January 2025 after nine hydrocarbon discoveries that still cannot be commercially developed. |
| The prize justifies the math: Chevron closed its $53 billion Hess acquisition in July 2025, after winning an ICC arbitration, largely for a 30% stake in Guyana’s 11-billion-barrel Stabroek block. |
| Rose’s AAPG framework (2001) remains the standard for prospect risking; ISO 31000 supplies the enterprise wrapper for appetite, portfolio governance, and HSE and political risk. |
Stabroek’s first well hit in 2015 in a basin where decades of earlier drilling had found nothing commercial. That is the whole business in one block: risk analysis and management of petroleum exploration decides which long odds are worth $50 million a well, and which are worth walking away from.
What Risk Analysis and Management of Petroleum Exploration Involves
Exploration risking is a specialized branch of risk assessment with its own canon: Peter Rose’s Risk Analysis and Management of Petroleum Exploration Ventures, published by AAPG in 2001, codified how explorers estimate chance of success, size prospects probabilistically, and manage portfolios of drilling bets.
The method sits inside the standard risk management process that ISO 31000 describes: identify what can fail, quantify likelihood and consequence, decide which bets fit appetite, then treat, monitor, and re-estimate. What changes is the arithmetic: exploration expresses nearly everything as probabilities and dollars before a bit turns.
| Risk family | What can go wrong | Primary management tool |
| Geological | No source, reservoir, trap, or seal; dry hole | Chance-of-success factors, seismic, well data |
| Volumetric | Hydrocarbons present but smaller than mapped | Probabilistic volumes (P90/P50/P10), Monte Carlo |
| Commercial | Discovery too costly to develop at forecast prices | EMV, development screening, price decks |
| Technical / HSE | Well control, deepwater complexity, blowouts | Engineering standards, barriers, BSEE oversight |
| Political / fiscal | License terms, sanctions, tax changes, delays | Country screening, contract design, diversification |
Why the Economics Leave No Room for Guesswork
The base rates are unforgiving and getting thinner. Westwood’s State of Exploration 2025 counted just 64 high-impact wells drilled in 2025, the fewest since 2008, delivering 4.8 billion barrels of oil equivalent at a 31 percent commercial success rate, up only modestly from 28 to 29 percent in 2023 and 2024.
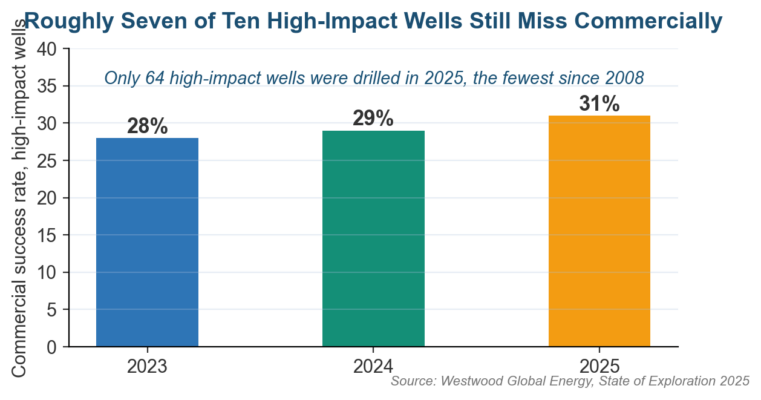
Figure 1. Roughly seven of ten high-impact exploration wells still fail commercially, even in a good year.
The longer arc is harsher still. Westwood puts discovered volumes from 2020-2024 down 62 percent against 2010-2014, with high-impact exploration replacing just 11 percent of produced hydrocarbons versus 33 percent a decade earlier, while Rystad’s 2026 outlook and Wood Mackenzie’s 2024 review tell the same story from different data.
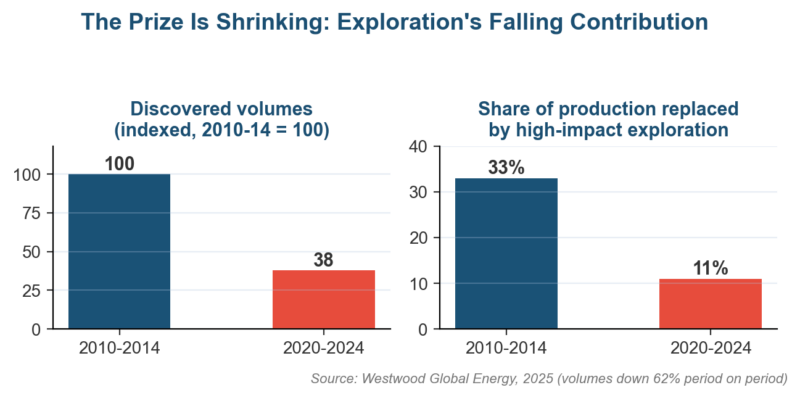
Figure 2. The shrinking prize: discovered volumes and exploration’s share of production replacement have both collapsed since 2010-2014.
Capital keeps flowing anyway, roughly $560 billion a year into upstream per the IEA’s World Energy Investment 2025, which is exactly why disciplined risking matters. A venture that cannot rank its prospects by risked value is allocating that capital by anecdote, and the case for formal risk management is nowhere stronger than here.
Scoring Geological Risk: The Chance-of-Success Method
Every prospect needs four things to have worked underground: a source rock that generated and expelled hydrocarbons, a reservoir porous enough to hold them, a trap shaped to gather them, and a seal that kept them in place. Risk identification in exploration is the geoscience of interrogating each element.
The Rose method assigns each factor a probability from the evidence: seismic character, offset wells, basin models, geochemistry. Multiplying them gives the chance of geological success, and the arithmetic is humbling; four individually decent factors of 0.80, 0.70, 0.60, and 0.75 compound to a 25 percent prospect.
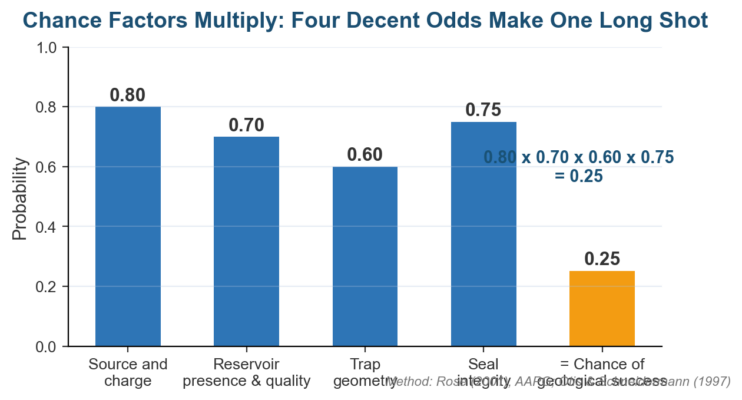
Figure 3. Chance factors multiply: four decent odds make one long shot, which is why calibration discipline matters.
| Chance factor | Evidence that moves it | Typical range on frontier prospects |
| Source and charge | Geochemistry, basin modeling, nearby shows | 0.5 – 0.9 |
| Reservoir | Seismic amplitudes, analog wells, cores | 0.5 – 0.9 |
| Trap geometry | Seismic mapping quality, structural complexity | 0.4 – 0.8 |
| Seal integrity | Regional caprock, fault analysis, pressure data | 0.5 – 0.9 |
Calibration is what keeps those probabilities honest over time. Companies audit predicted versus actual outcomes across years of drilling results, exactly the feedback loop a risk assessment methodology demands, because teams left unaudited drift optimistic, and Rose built the framework around that bias.
Shell’s Namibia campaign shows what the next gate costs. Nine hydrocarbon discoveries on license PEL 39 still ended in a $400 million write-down in January 2025, because reservoir quality left the finds uncommercial; a positive chance-of-success outcome bought a discovery, not a business.
From Probability to Money: EMV and the Drill Decision
Chance of success prices the odds; expected monetary value prices the bet. EMV multiplies the probability of success by the success-case net present value, subtracts the probability of failure times the dry-hole cost, and yields a single risked number every prospect in the portfolio can be ranked by.
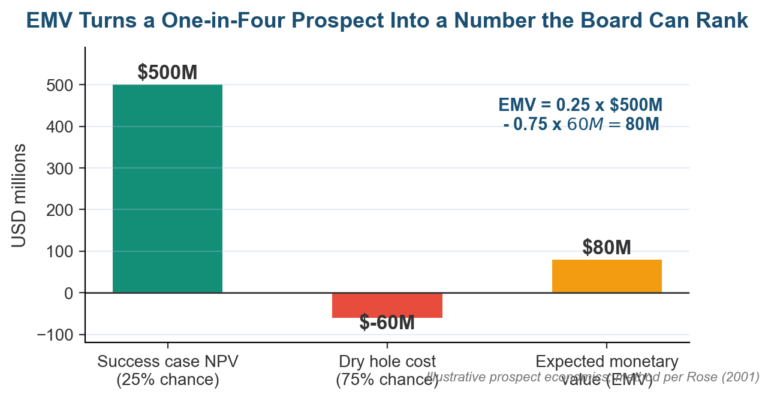
Figure 4. EMV turns a one-in-four prospect into a rankable number: $80 million risked value on this illustrative well.
Volumes get the same probabilistic treatment. Explorers quote P90, P50, and P10 outcomes from Monte Carlo simulation rather than single numbers, the quantitative assessment tradition at full strength, and report discoveries under SPE’s Petroleum Resources Management System while U.S. filers follow the SEC’s reserves disclosure rules.
Sizing the Prize: P90, P50, and P10
Reserve ranges express volumetric risk the way chance factors express geological risk. P90 is the conservative outcome the venture is 90 percent confident of exceeding, P50 the median, and P10 the upside tail; the spread between them tells an investment committee how much the mapping is really guessing.
| Case | Confidence level | Illustrative volume | Role in the decision |
| P90 | 90% chance of exceeding | 40 million barrels | Downside screening, debt sizing |
| P50 | 50% chance of exceeding | 110 million barrels | Base-case economics and EMV |
| P10 | 10% chance of exceeding | 260 million barrels | Upside case and option value |
Skewed spreads are information in their own right. A prospect whose P10 dwarfs its P50 is a lottery ticket with real option value, while a tight range signals a well-understood play; portfolio construction wants a deliberate mix of both, not whichever geometry the loudest advocate mapped last.
Price assumptions carry as much risk as the geology. A prospect that clears its hurdle at $80 oil can die at $60, so mature shops stress EMV across price decks and demand data from EIA benchmarks and USGS resource assessments rather than a single in-house forecast. Sensitivity analysis is not garnish here; it is the decision.
Managing the Risks You Choose to Drill
Single wells are gambles; portfolios are strategy. Rose’s central management insight is that a program of eight independent 25 percent prospects has a 90 percent chance of at least one success, so the risk management techniques that matter most are diversification across basins, plays, and partners.
Risk sharing is the industry’s signature move. Farm-outs trade working interest for carried costs, exactly the transfer family in any treatment taxonomy, and the Stabroek joint venture that spent two years in arbitration exists precisely because ExxonMobil, Hess, and CNOOC each preferred a share of a giant bet to the whole of a smaller one.
What a Farm-Out Really Prices
Farm-out terms are the market’s read on your risking. A partner earning 40 percent of a license by paying 60 percent of well costs is buying your chance factors at an implied price, and consistent failure to attract partners on standard promotes is external peer review telling you the portfolio is overpriced.
Insurance completes the transfer stack: well control and blowout cover, business interruption on long-lead equipment, and political risk insurance in frontier jurisdictions. What no policy covers is a dry hole, which is why exploration capital is equity capital, priced through EMV rather than premium.
Four practices separate managed exploration portfolios from collections of hunches, and each one leaves an audit trail an investment committee can test. None requires new software; all four require somebody senior enough to enforce them when a favorite prospect scores badly:
- A written exploration risk appetite, set like any risk appetite statement: maximum net dry-hole exposure per year, per basin, and per well
- Independent peer review of every chance-of-success estimate before it enters the portfolio ranking
- Look-back audits comparing predicted POS and volumes against drilled outcomes, published internally
- Stage gates from lead to prospect to drill decision, each with a documented mitigation plan for the risks carried forward
Technical, HSE, and Political Risk Around the Wellbore
Subsurface odds are only half the exposure. The 2010 Macondo blowout, investigated in depth by the U.S. Chemical Safety Board, killed 11 workers and has cost BP more than $65 billion by the company’s own accounting, a permanent lesson that barrier discipline and well control belong in the same register as dry-hole risk.
Offshore U.S. operators answer to BOEM for leasing and to BSEE for safety and environmental enforcement after Macondo reshaped both agencies, and the operational risk playbook applies in full: engineered barriers first, procedures second, and scenario exercises that rehearse the blowout nobody expects.
Political and fiscal risk rounds out the register: license stability, tax regimes, sanctions exposure, and host-government capacity all move venture value as surely as porosity. Frontier portfolios screen countries the way geologists screen basins, and an enterprise risk management framework is where those judgments become policy rather than opinion.
| Political and fiscal factor | What it moves | Screening evidence |
| License and contract stability | Whether agreed terms survive elections | Track record of honored contracts, arbitration history |
| Fiscal take and progressivity | Success-case NPV and breakeven price | Government-take modeling across price decks |
| Sanctions and export routes | Marketability of any production | OFAC and EU exposure, infrastructure access |
| Local content and permitting | Schedule, cost, and social license | Historical project timelines in the jurisdiction |
Fiscal design interacts with geology more than most registers admit. A high-take regime can render a mid-size discovery uncommercial in exactly the way poor reservoir quality does, so venture screening runs government take through the same EMV machinery as porosity; either lever can kill a find on its own.
Risk Analysis and Management of Petroleum Exploration: Your Questions Answered
What does risk analysis and management of petroleum exploration ventures involve?
It involves estimating each prospect’s chance of geological success from source, reservoir, trap, and seal factors, converting the odds into expected monetary value, and managing a diversified portfolio of drilling decisions alongside technical, HSE, commercial, and political risks. Rose’s 2001 AAPG framework defines the standard method most operators still use.
How is chance of success calculated for an exploration prospect?
Geoscientists assign a probability to each independent play element, typically source and charge, reservoir presence and quality, trap geometry, and seal integrity, then multiply them. Four factors of 0.80, 0.70, 0.60, and 0.75 compound to 0.25, which is why even attractive frontier prospects carry one-in-four odds.
What is expected monetary value in petroleum exploration risk analysis?
EMV is the probability-weighted worth of drilling: chance of success times success-case NPV, minus chance of failure times dry-hole cost. A 25 percent prospect with a $500 million success case and a $60 million dry hole carries an $80 million EMV, a number boards can rank against every alternative use of the capital.
Why do most petroleum exploration wells fail commercially?
Because two gates stand between spud and value: the geology must work, and the discovery must be economic. Westwood’s 2025 data puts commercial success at 31 percent for high-impact wells, and Shell’s nine Namibian discoveries written down for $400 million in January 2025 show a find can still fail the second gate.
What is the difference between geological risk and commercial risk in exploration?
Geological risk is the chance the well finds no producible hydrocarbons at all; commercial risk is the chance a genuine discovery cannot be developed profitably at realistic prices, costs, and fiscal terms. The first is scored with chance factors, the second with development screening, price decks, and EMV.
How many wells does a portfolio need for a likely discovery?
Binomial arithmetic answers this. Eight independent prospects at 25 percent each give a 90 percent chance of at least one success, while three give only 58 percent; that is why serious explorers fund programs, not single wells, and why concentration in one basin quietly destroys the diversification the math assumes.
Which standards govern risk analysis and management of petroleum exploration reporting?
SPE’s Petroleum Resources Management System classifies resources and reserves for internal and industry reporting, while SEC rules govern what U.S.-listed companies may book as proved reserves. ISO 31000 supplies the enterprise risk wrapper, and offshore U.S. operations sit under BOEM leasing and BSEE safety regulation.
Where Exploration Risking Goes Wrong
Six failure patterns recur across exploration post-mortems, and every one of them is a governance defect before it is a geoscience defect. Watch the first two especially; optimism bias and ignored calibration are the exploration industry’s versions of the untreated register, and look-backs expose both within a season.
| Pitfall | Root cause | Remedy |
| Optimistic chance factors | Advocacy scoring by the team that owns the prospect | Independent peer review before portfolio entry |
| No look-back calibration | Predictions never compared with drilled outcomes | Annual predicted-vs-actual audit, published internally |
| Single-price economics | One in-house deck treated as the future | Stress EMV across at least three price scenarios |
| Discovery declared victory | Commercial gate skipped in the excitement | Screen development economics before announcing success |
| Portfolio of look-alikes | Every prospect in one basin or play type | Diversify by basin, play, and partner; cap concentrations |
| HSE risk siloed from subsurface risk | Separate teams, separate registers | One venture register spanning dry hole to blowout |
Where Exploration Risking Heads Through 2028
Consolidation is concentrating the bets. Chevron-Hess closed at $53 billion, ExxonMobil absorbed Pioneer, and fewer, larger portfolios mean each drilling decision moves more capital, which pushes chance-of-success discipline and risk-based governance further up the board agenda rather than down into technical teams.
The well count keeps falling while selectivity rises: 64 high-impact wells in 2025 against hundreds a decade ago, with Rystad projecting success rates near 38 percent as portfolios high-grade. Fewer, better-risked wells is the strategy everywhere, and it rewards exactly the calibration and assessment rigor this discipline formalizes.
Energy transition pressure completes the picture. Investment committees now weigh exploration EMV against renewables and return-of-capital alternatives, and ventures that cannot show a defensible risk lifecycle from chance factors to portfolio KRIs will not get funded. The method Rose wrote down in 2001 has become the price of admission.
Riskpublishing helps energy and resources risk teams build venture risking that stands up to investment committees, from register design to board reporting. Our services include exploration and project risk frameworks; contact us if your portfolio ranking still runs on adjectives.

Chris Ekai is a Risk Management expert with over 10 years of experience in the field. He has a Master’s(MSc) degree in Risk Management from University of Portsmouth and is a CPA and Finance professional. He currently works as a Content Manager at Risk Publishing, writing about Enterprise Risk Management, Business Continuity Management and Project Management.