A risk assessment tool is a structured technique for identifying, analyzing and evaluating risk, such as a risk matrix, a bowtie diagram, failure modes and effects analysis, or Monte Carlo simulation. IEC 31010:2019 catalogues these techniques. Software platforms host them, but the tool itself is the method.
On 31 August 2025 the Federal Financial Institutions Examination Council formally retired the Cybersecurity Assessment Tool, the free instrument thousands of US banks and credit unions had run since 2015. The council had announced the sunset a year in advance, and the deadline passed regardless of readiness.
State regulators spent the intervening months telling institutions to prepare. The Texas Department of Banking published its own transition notice, pointing examinees toward replacement frameworks and urging early analysis, while the accounting firm BDO warned that the retirement left a governance gap institutions had to fill deliberately rather than allow to close by default.
| Risk Assessment Tool: Key Takeaways |
| In risk practice a tool usually means a technique rather than a software product. IEC 31010:2019 catalogues them, describing each technique’s uses, inputs, outputs, strengths and limitations across two informative annexes. |
| The FFIEC retired its Cybersecurity Assessment Tool on 31 August 2025, sending US institutions to NIST CSF 2.0, the Cyber Risk Institute Profile, CISA’s performance goals or the CIS Controls instead. |
| Pick the risk assessment tool by the question. Ranking risks needs a matrix, testing whether a control works needs a bowtie, and defending a budget figure needs simulation. No single tool answers all three. |
| Rigor costs effort in a fairly straight line. A checklist takes an hour and proves little; a Monte Carlo model takes weeks and survives challenge, so match the spend to how contested the decision is. |
| The same hazard produces three different, all correct, answers depending on the tool used. A matrix gives a rank, a bowtie gives a control gap, and simulation gives a number you can put in a budget. |
| Agencies publish free named tools worth knowing: NIST’s Privacy Risk Assessment Methodology, the World Health Organization’s STAR toolkit, and CISA’s cross-sector performance goals among them. |
| Precision is not accuracy. A tool that outputs 17.4 from three guessed inputs is less honest than a matrix that says high, and the number’s authority grows faster than its evidence does. |
That episode is the clearest recent lesson about risk assessment tools in our field. No risk assessment tool is permanent or neutral, and choosing one carries consequences, which is why BDO framed the sunset as a governance question rather than a purely technical one.
What a Risk Assessment Tool Is, and What It Is Not
The word tool carries two meanings in risk work, and conflating them causes most of the confusion. One meaning is a technique: a documented method for reasoning about a hazard. The other is a product you buy a license for.
The techniques are the subject here. A bowtie diagram is a risk assessment tool in the sense that a scalpel is a tool, whereas a platform is closer to the operating theatre it gets used in. Both matter, and they are not substitutes for each other.
| Dimension | A technique | A software platform |
| What it is | A documented method: matrix, bowtie, FMEA, fault tree, simulation. | A licensed system that stores registers, routes approvals and reports. |
| What it decides | How you reason about one hazard and what evidence you need. | How a hundred assessments get administered, versioned and reported. |
| Cost | Training time and analyst hours. No purchase required. | Subscription, implementation, integration and administration. |
| Portability | Survives any vendor change; the method belongs to you. | Switching means migration, and historic scores may not travel cleanly. |
| Failure mode | Wrong technique for the question, so the output misleads. | Nobody updates it, so the register goes stale and looks authoritative. |
Table 1. The two things people mean by a risk assessment tool, and why the distinction changes what you buy.
If your question is which platform to license, that is a separate decision with its own criteria, and our guide to choosing risk assessment software covers scorecards and total cost. The risk assessment tools below are what any platform ends up running.
The Toolbox Behind the Term
The reference document for risk assessment tools is IEC 31010:2019, the companion standard to ISO 31000. It does not rank the techniques or crown a winner among them. It describes each one’s purpose, inputs, outputs, strengths and limitations, then leaves the selection decision to you.
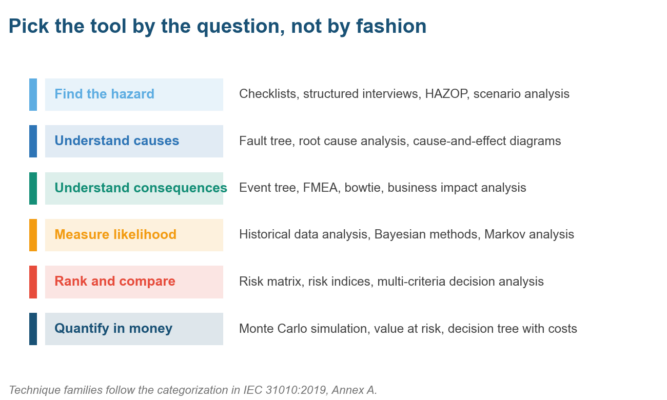
Figure 1. Grouping risk assessment tools by job rather than by name is the fastest way to narrow a shortlist.
Grouping by job exposes an error we see constantly. Teams reach for the matrix because it is familiar, then use it to answer a question about control effectiveness, which is something a matrix was never built to address at all.
| Technique | The question it answers | Where it earns its place |
| Risk matrix | How does this risk rank against everything else on the register? | Board reporting and prioritization, when many risks need one comparable scale. |
| Bowtie analysis | Which barriers prevent this event, and which limit the damage? | Major hazard work where control assurance matters more than a score. |
| FMEA | Where can this process fail, how badly, and would we detect it? | Design, manufacturing and clinical processes with many discrete failure points. |
| Fault tree | What combination of failures has to occur for this event to happen? | Engineered systems with redundancy, where combinations matter more than singles. |
| HAZOP | What happens if this parameter deviates from its design intent? | Process industries: chemical, energy, pharmaceutical plant design and change. |
| Monte Carlo | What is the distribution of outcomes, not just the single point estimate? | Cost, schedule and capital decisions where a range beats a best guess. |
Table 2. Six risk assessment tools, stated as the question each is built to answer.
Several of these techniques have their own guides on this site already. Our walkthroughs of the CRAMM method, NUDD scoring and the HACCP matrix show how sector-specific risk assessment tools adapt that same underlying logic to very different classes of hazard.
Qualitative, Quantitative, and the Cost of Rigor
Risk assessment tools sit on a spectrum running from purely descriptive to fully numerical, and the trade-off along that spectrum is simple enough. More rigor costs more effort, and effort is the binding constraint that most risk teams actually face day to day.
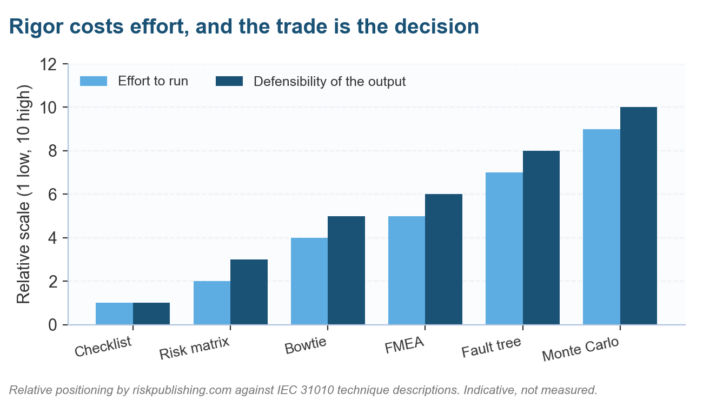
Figure 2. Effort and defensibility rise together. The question is how contested your decision will be.
Choose the cheapest risk assessment tool that will still survive the challenge you actually expect. A matrix is entirely adequate for prioritizing a register that nobody will litigate, and hopeless for defending a capital number in front of a finance committee that will.
- Qualitative risk assessment tools (checklist, matrix, structured interview) are fast, need no historic data, and are transparent to non-specialists. They cannot support a number.
- Semi-quantitative techniques (risk indices, weighted scoring, FMEA severity ratings) attach figures to judgment. The figures compare well internally and travel badly outside the organization.
- Quantitative risk assessment tools (fault tree, Monte Carlo simulation, Bayesian analysis) produce defensible ranges, and demand real data plus someone who can explain the assumptions under questioning.
Data availability decides more of this question than methodological preference ever does. Where you hold years of loss events a quantitative risk assessment tool is within reach, and where you hold none, the simulation simply launders your own assumptions into tidy decimal places.
Matching the Risk Assessment Tool to Your Question
Risk assessment tool selection deserves a written rationale rather than an inherited habit. A peer-reviewed guide in the clinical literature sets out a ten-point approach to choosing an assessment instrument, and its logic transfers cleanly into ordinary organizational risk work as well.
| If your question is | Reach for | Because |
| Which of these 60 risks go to the board? | Risk matrix on an anchored scale. | Comparability across categories is what a matrix is designed to deliver. |
| Are our controls on this hazard actually working? | Bowtie analysis with barrier testing. | It forces each barrier to be named, owned and evidenced separately. |
| Where will this new process break? | FMEA across the process steps. | It examines failure modes systematically rather than waiting for incidents. |
| How much should we budget for this exposure? | Monte Carlo or a costed decision tree. | A distribution supports a reserve figure; a color band does not. |
| Is this plant design safe to operate? | HAZOP with the design team. | Deviation-by-deviation review catches interactions a checklist misses. |
| Which vendors deserve deeper diligence? | A categorization tool or risk index. | Tiering many entities quickly is a screening job, not an analysis job. |
Table 3. Six common questions and the risk assessment tool each one points to.
Screening tools deserve more respect than they get. Our guide to the risk assessment categorization tool covers tiering method, and the free online risk matrix generator plus the business impact estimator let you run two of these without any procurement.
Whatever technique wins, the output has to land somewhere durable. A scored risk that never reaches a maintained risk register is analysis nobody can act on, which is the argument for treating risk assessment tool choice as part of a wider risk assessment program.
One Hazard, Three Tools, Three Answers
Abstract comparison only goes so far, so here is a single exposure run three separate ways. The hazard is the loss of a sole claims-processing vendor holding records for 41,000 members, assessed each time on exactly the same underlying evidence.
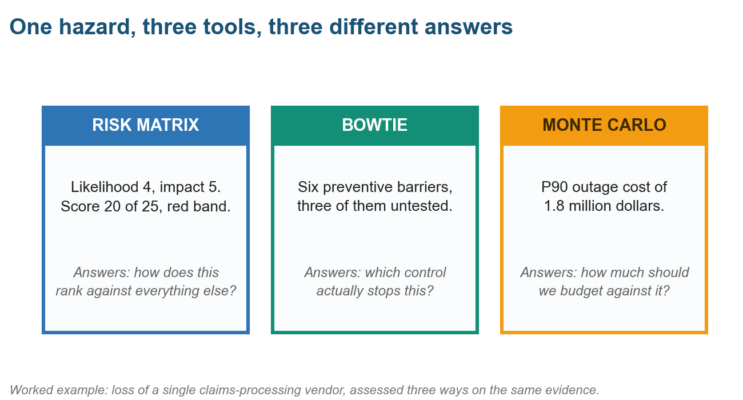
Figure 3. Same hazard, same evidence, three outputs. None of them is wrong; they answer different questions.
| Tool | What it produced | What it could not tell us |
| Risk matrix | Likelihood 4, impact 5, inherent score 20 of 25, placing it top of the register. | Whether any specific control reduces it, or how much money to set aside. |
| Bowtie | Six preventive barriers identified, three with no evidence of testing in twelve months. | How this exposure compares with the other 59 risks competing for budget. |
| Monte Carlo | A P90 outage cost of 1.8 million dollars across notification, downtime and remediation. | Which barrier to fix first, or why the likelihood input was set where it was. |
Table 4. Three risk assessment tools on one hazard, with the blind spot of each stated plainly.
Read the blind spots column twice before choosing anything. The practical answer for any material exposure is usually two risk assessment tools rather than one, because the ranking question and the control question are two separate problems, each needing its own method.
Pairing also protects against the weakest habit in the field, which is scoring a risk once and never testing whether the score moved. The inherent to residual method only means something when a control has been tested, and an RCSA cycle is where that testing usually lives.
Named Tools Agencies and Regulators Publish
Alongside the generic risk assessment tools sit named instruments published by agencies, usually free of charge and often expected by examiners. Knowing which ones exist saves you the trouble of building something a regulator already publishes and will readily recognize in an examination.
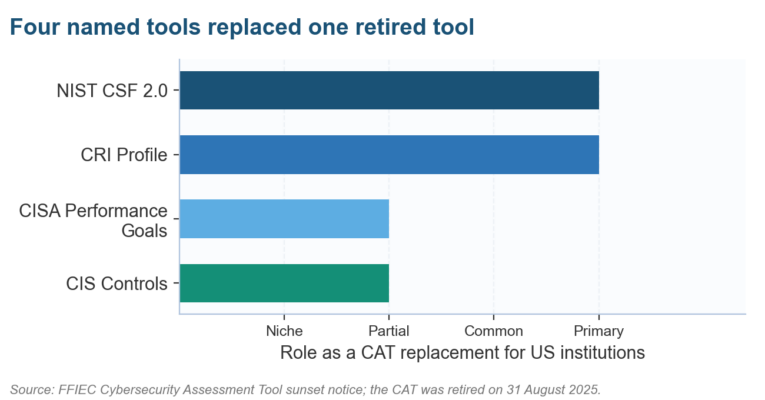
Figure 4. One retirement, four replacement paths, and a decision every US institution had to document.
| Named tool | Publisher and status | Who it is aimed at |
| Cybersecurity Assessment Tool | FFIEC, retired 31 August 2025. | US banks and credit unions, now redirected to the frameworks below. |
| NIST CSF 2.0 | NIST, current and widely adopted. | Any organization; the most common CAT replacement in US financial services. |
| CRI Profile | Cyber Risk Institute, current. | Financial institutions wanting a sector-tuned mapping of CSF and other rules. |
| Cybersecurity Performance Goals | CISA, current. | Critical infrastructure operators looking for a prioritized baseline. |
| CIS Controls | Center for Internet Security, current. | Technical teams wanting prioritized, testable safeguards. |
| Privacy Risk Assessment Methodology | NIST, current. | Teams assessing privacy risk rather than security risk, per NISTIR 8062. |
| STAR toolkit | World Health Organization, current. | Public health authorities running all-hazards emergency risk assessment. |
Table 5. Seven named risk assessment tools, their publishers, and the audience each was written for.
The privacy entry is the one most risk teams miss entirely. NIST’s Privacy Risk Assessment Methodology applies the risk model from NISTIR 8062, which treats privacy harm as distinct from a security breach rather than a subset of it.
For the replacements themselves, always go to the primary sources rather than a summary. The NIST Cybersecurity Framework, the CRI Profile, CISA’s performance goals and the CIS Controls are all published free of charge and are kept current by their publishers.
Sector instruments follow the same pattern of a published method plus an expectation of use. Our guides to the FFIEC tool and its successors, the NFPA assessment tool and the Ohio Risk Assessment System cover three very different examples.
When the Number a Tool Produces Should Not Be Trusted
Every risk assessment tool carries its own failure mode, and most of them share a single symptom: an output far more precise than the evidence underneath it. Naming the limitation next to the result is what separates honest analysis from expensive decoration.
| Technique | Its known weakness | What to do about it |
| Risk matrix | Ordinal bands get treated as arithmetic, and a 4 is not twice a 2. | Never average or multiply matrix scores across risks; use them to rank only. |
| Bowtie | Barriers get drawn because they exist, not because anyone tested them. | Record a test date and result against every barrier, or mark it unverified. |
| FMEA | Detection scores are guessed, which quietly distorts the priority number. | Base detection on measured escape rates where any data exists at all. |
| Monte Carlo | Distributions chosen for convenience, correlations assumed away entirely. | State every distribution and correlation assumption on the same page as the output. |
| Checklists | They confirm what the author already thought of and nothing beyond it. | Pair with an open technique such as a workshop or structured what-if review. |
Table 6. Five risk assessment tools and the specific way each one misleads when used carelessly.
The matrix warning matters most because matrices are everywhere. Bands are ordinal labels rather than measurements, so multiplying them produces a number carrying arithmetic properties that the underlying judgments never had, and the product looks far more precise and more defensible than either input ever was, as our comparison of 5×5 and 4×4 scoring scales explains.
Frequently Asked Questions About Risk Assessment Tools
What is a risk assessment tool?
A risk assessment tool is a structured technique for identifying, analyzing and evaluating risk. Examples include the risk matrix, bowtie analysis, FMEA, fault tree analysis and Monte Carlo simulation. IEC 31010:2019 is the standard that catalogues these techniques and describes the strengths and limits of each.
Is a risk assessment tool the same as risk assessment software?
No. The tool is the method, while the software is the system that hosts it. A platform typically implements a matrix and a register, then adds workflow, permissions and reporting on top, but you can run any technique at all without buying software.
Which risk assessment tool should I use?
Choose by the question you need answered. Ranking many risks points to a matrix, testing control effectiveness points to a bowtie, finding process failure points suggests FMEA, and budgeting for an exposure calls for simulation. Material risks usually justify two techniques rather than one.
What are qualitative and quantitative risk assessment tools?
Qualitative risk assessment tools describe risk in words and bands, needing no historic data and staying transparent to non-specialists. Quantitative techniques produce numbers and ranges, needing real data and defensible assumptions. Semi-quantitative methods sit between, attaching scores to judgment for internal comparison only.
Are there free risk assessment tools?
Many of the best are free. NIST publishes its Privacy Risk Assessment Methodology and the Cybersecurity Framework, CISA publishes performance goals, the World Health Organization publishes the STAR toolkit, and Ready.gov offers a business risk assessment starting point at no cost.
What happened to the FFIEC Cybersecurity Assessment Tool?
The FFIEC retired it on 31 August 2025, having announced the sunset a year earlier. Institutions were directed toward NIST CSF 2.0, the Cyber Risk Institute Profile, CISA’s Cybersecurity Performance Goals and the CIS Controls, with the first two proving the most common replacements.
How often should we review our choice of tool?
Review whenever the question changes, the standard is withdrawn, or the technique stops surviving challenge. In practice that means an annual look alongside the assessment cycle, plus an immediate review when a publisher retires an instrument you currently depend on.
Do small organizations need formal risk assessment tools?
Yes, though not elaborate ones. A well-anchored matrix and a maintained register handle most of what a small organization needs. The discipline that matters is consistency of method and named ownership, neither of which requires an expensive technique or a platform.
Where Risk Assessment Tool Choice Goes Wrong
The failures below show up repeatedly in programs that picked a perfectly credible risk assessment tool and still produced output nobody trusted. Each one is a selection error rather than an execution error, which makes them unusually cheap to avoid up front.
| Failure | How it shows up | The correction |
| One tool for every question | The matrix is used to assess control effectiveness and produces a color, not an answer. | Keep at least three techniques in active use and pick per question. |
| False precision | A score of 17.4 derived from three estimated inputs, quoted without its assumptions. | Publish the inputs beside the output, or round back to bands and say so. |
| Technique without data | Simulation run on invented distributions because the method looked rigorous. | Fall back to semi-quantitative scoring until real loss data exists. |
| Unowned barriers | A bowtie full of controls with no owner and no test date attached to any of them. | Require an owner and a last-tested date per barrier before the diagram is accepted. |
| Depending on a published tool | A regulator retires the instrument and the program has no fallback method. | Document why the tool was chosen, so a replacement can be selected on the same criteria. |
| Scale drift between tools | FMEA severity and matrix impact use different definitions of the same consequence. | Anchor one consequence scale and map every technique’s ratings back to it. |
Table 7. Six selection failures, each with the correction that prevents it.
The last row causes quiet damage in mature programs. When a plant team’s FMEA severity rating and the corporate matrix impact band quietly mean different things, aggregate reporting stops being meaningful long before anyone realizes it, and nobody tends to notice until two numbers openly disagree in front of a board.
Where the Toolbox Is Heading
Retirement risk is now a planning concern in its own right. The FFIEC sunset showed thousands of institutions what happens when a risk assessment tool they had treated as permanent public infrastructure stops being maintained, and the replacement decision arrives on somebody else’s deadline.
Quantification has moved from specialist work to a standard board expectation. Boards now ask for ranges rather than colors, and the NIST SP 800-30 vocabulary plus growing interest in cyber risk quantification keep pulling technique choice steadily up the rigor scale.
Governance has absorbed the choice as well, not just the output. IEC 31010 sits underneath ISO 31000, and the COSO framework expects the same discipline, so a technique now has to be justified in governance terms rather than by analyst preference alone.
Start with Table 3 rather than a software demo. Write down the question you actually need answered, pick the cheapest technique that survives the challenge you expect, and record why you chose it, in case its publisher later retires it.
If you are a US risk lead who has inherited a matrix that answers every question and convinces nobody, we help teams anchor a scale and choose techniques that hold up in front of an examiner. See how we work, or write to us describing the decision your current tool keeps failing to settle.

Chris Ekai is a Risk Management expert with over 10 years of experience in the field. He has a Master’s(MSc) degree in Risk Management from University of Portsmouth and is a CPA and Finance professional. He currently works as a Content Manager at Risk Publishing, writing about Enterprise Risk Management, Business Continuity Management and Project Management.