Key risk indicators earn their board seat every time an institution fails with the warnings already written down. When Silicon Valley Bank collapsed in March 2023 holding $209 billion in assets, the Federal Reserve’s own review counted 31 unaddressed supervisory findings, roughly triple the average at peer banks.
The indicators existed; the response did not. Vice Chair Michael Barr’s report found warnings that were slow to escalate and slower to force action, and NPR’s summary of the postmortem made the lesson public for every risk committee: measurement without escalation is expensive decoration.
| Key Risk Indicators: Key Takeaways |
| Silicon Valley Bank failed in March 2023 holding $209 billion in assets and 31 unaddressed supervisory findings, triple its peer average, per the Federal Reserve’s Barr review. |
| A key risk indicator is a measurable early warning tied to a specific risk, with a target, tolerance, and breach threshold, and a named owner accountable for each band. |
| Good KRIs are predictive, measurable from existing data, sensitive enough to move before losses do, and few enough that every one gets read. |
| Thresholds do the safeguarding: green means monitor, amber means mitigate and report, red means escalate the same week, never the next quarter. |
| This directory indexes 60+ riskpublishing.com KRI guides by industry, business function, and risk category, plus the 150-KRI library and free Excel template. |
| Trend KRIs quarterly at board level; a falling metric with rising near misses signals measurement decay rather than improvement. |
This directory is the index for our entire key risk indicators library. It covers what makes a KRI work, how to design thresholds, and where governance fails, then routes you to the purpose-built guide for your industry, your function, or the risk category on this quarter’s agenda.
What Key Risk Indicators Do for a Risk Program
A key risk indicator is a measurable metric tied to a specific risk that moves before the loss arrives, giving management time to act. Our
key risk indicators examples guide is the foundational read, and the
150-KRI library organized by category supplies ready-made candidates with thresholds.
The leading-versus-lagging distinction decides whether a metric warns or merely records history. Loss counts and audit findings look backward; pipeline metrics, aging backlogs, and near-miss rates look forward, and a working key risk indicators scorecard needs both types, weighted toward the forward-lookers.
| Indicator type |
What it measures |
Example |
| Leading KRI |
Conditions that precede losses |
EDD case backlog aging past SLA |
| Lagging KRI |
Losses and failures already realized |
Confirmed fraud loss in the quarter |
| Control KRI |
Health of a specific control |
Share of alerts cleared within target |
| Exposure KRI |
Size of the bet, however well controlled |
Single counterparty concentration |
Standards give KRIs their governance home.
ISO 31000 places them inside monitoring and review,
COSO ERM ties them to risk appetite, and bank supervisors expect them wired into escalation, a point
Barr made explicit in his supervision speeches after SVB.
Appetite gives the numbers their meaning. A key risk indicator without an appetite statement behind it is a weather report with no definition of storm, so publish the appetite boundary next to every metric and let the two documents reference each other explicitly, revision by revision.
KRIs also close the loop on assessment work already done. Every high-rated risk in the register should hand its owner at least one forward-looking indicator, which turns the annual assessment from a snapshot into a monitoring system that runs between reviews and catches drift early.
Designing Key Risk Indicators That Actually Warn
Design decides everything downstream, so build each key risk indicator against four tests: predictive of the named risk, measurable from data you already produce, sensitive enough to move before losses, and cheap enough to refresh on schedule. Our
KRI development guide turns the tests into a worksheet.
Thresholds convert measurement into obligation. Set a target, an appetite boundary, and a tolerance boundary, and define in advance what each band triggers, because a threshold nobody pre-agreed becomes a negotiation during the exact week nobody has time for one.
Assign the owner before approving the metric, because ownership is the difference between a dashboard and a control. The owner answers for the data feed, explains every amber in one written line, and executes the red-band action, and no key risk indicator enters the scorecard without that name attached.
Pilot before you standardize. Run a candidate KRI in shadow for one quarter, check that it would have moved ahead of the incidents you actually had, and only then give it thresholds and a reporting slot. Shadow quarters kill weak metrics cheaply, before they earn false credibility on the scorecard.
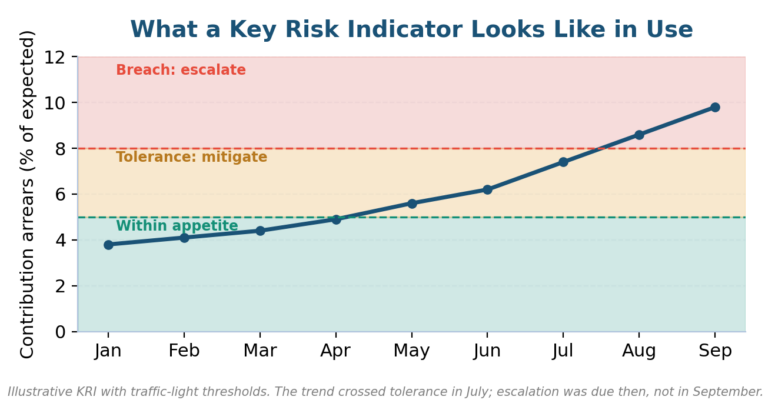 Figure 1. The trend crossed tolerance in July; a working program escalates then, not at year-end.
Packaging determines whether anyone acts. The
step-by-step KRI scorecard guide builds the reporting layer,
dashboard examples show the formats boards actually read, and the
free KRI Excel template gets a first scorecard running this week without a procurement cycle or a software demo.
Watch for correlation between indicators before trusting the count. Five metrics that all track headcount stress are one indicator wearing five costumes, and the diversification test is simple: if one root cause could move them all this quarter, the scorecard is thinner than it looks on paper.
Key Risk Indicators by Industry: The Directory
Generic metrics miss the risks that make each industry distinctive, which is why this library exists. Every guide below carries sector-specific key risk indicators with suggested thresholds and data sources, written to be lifted straight into a scorecard and calibrated locally.
Start with your sector guide, then borrow from the neighbors, because the best scorecards steal shamelessly across industries. A hospital’s patient-safety indicators translate to any high-consequence operation, and banking’s concentration metrics fit every organization whose revenue depends on a top-heavy customer list.
A practical selection rule for the directory: pull your sector guide plus the two function guides your committee actually staffs, usually IT and finance, and build the first scorecard from that trio. Fifteen indicators from three sources beat fifty from ten, and the scorecard ships this quarter.
Key Risk Indicators by Risk Category
Category guides cut across industries for practitioners who own a risk type enterprise-wide. Each one pairs the key risk indicators with the loss patterns they predict, so a category owner can defend the selection in front of a risk committee without improvising.
Cross-category context keeps the numbers honest.
Uptime Institute’s outage analysis benchmarks operational downtime,
IBM’s breach report prices cyber events, and
Splunk’s downtime research totals the cost across the Global 2000, and all three make useful external anchors when calibrating thresholds against something firmer than instinct.
Industry and category views overlap by design, never by accident. A bank pulls credit and liquidity KRIs from the category guides and branch-level metrics from the banking guide, and where the two disagree on a threshold, the more conservative band wins until a re-validation settles the question with data.
Governing Key Risk Indicators: Thresholds, Owners, and Reporting
SVB is the governance case study because the failure was procedural, never informational. Indicators fired, findings accumulated, and
the GAO later concluded that escalation lacked speed and force. The lesson for every key risk indicators program: wire the response, not just the metric.
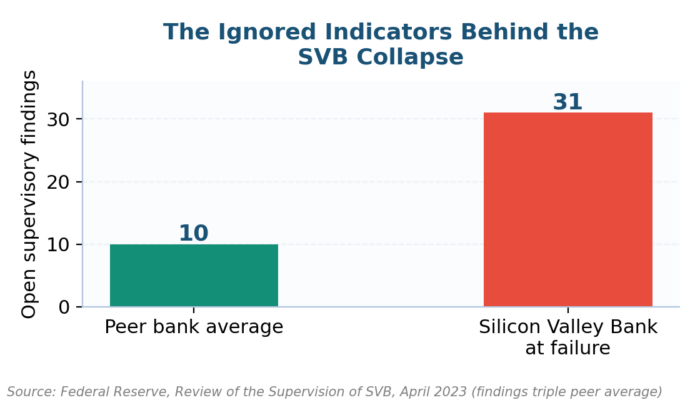 Figure 2. Triple the peer average and still unescalated: measurement without response, per the Federal Reserve.
The timeline made the mechanism visible. Supervisors had rated the bank’s governance deficient well before the run, deposits had concentrated in a single sector, and unrealized losses were sitting in plain sight on the balance sheet, three indicators any scorecard would carry, none of them wired to force a decision.
| Governance element |
Minimum standard |
Failure mode it prevents |
| Named owner per KRI |
One accountable person, not a committee |
Metrics everyone watches and nobody acts on |
| Written threshold actions |
Amber and red responses pre-agreed |
Mid-crisis negotiation of what red means |
| Escalation clock |
Red reaches executives within days |
The SVB pattern: findings aging quietly |
| Data lineage |
Source, formula, and refresh date recorded |
Unfalsifiable numbers nobody can audit |
| Annual re-validation |
Each KRI re-tested for predictive value |
Zombie metrics surviving on habit |
| Board trend reporting |
Quarterly trends, not point-in-time values |
Slow deterioration hiding in snapshots |
Near misses deserve their own line on every key risk indicators report. A quarter with zero losses and rising near misses is deterioration wearing good luck, and boards that see both series together stop mistaking fortunate outcomes for working controls, which is the report’s entire purpose.
Reporting cadence follows the metric’s velocity. Fast movers such as liquidity and cyber indicators run weekly or continuously, most operational KRIs run monthly, and the board sees quarterly trends, a rhythm
CNBC’s SVB coverage showed failing at every level when it matters most.
Put the key risk indicators report in the same committee pack as the risk register and the incident log, every quarter, in that order. When the three documents travel together, a rising indicator, an unchanged register entry, and a fresh incident in the same domain become impossible to read as three separate stories.
Lessons from Key Risk Indicator Programs That Failed
Failed programs share an autopsy pattern, and none of the causes is exotic. The table collects the six we see most in reviews of key risk indicator programs, each paired with the design habit that would have prevented it, and every remedy is retrofittable.
| Failure pattern |
Autopsy finding |
Preventive habit |
| Metric sprawl |
80 KRIs, none read past page two |
Cap at 10-15 per audience; retire one to add one |
| Thresholds set to flatter |
Bands calibrated so nothing ever goes red |
Back-test bands against the last three incidents |
| KPIs wearing KRI badges |
Performance metrics recycled as risk metrics |
Every KRI names the risk it predicts, in writing |
| Data theater |
Manually keyed numbers nobody can trace |
Automate the feed or drop the metric |
| Escalation optional |
Red status noted in minutes, no action |
Red triggers a named meeting within five days |
| Set-and-forget |
2019 thresholds still running in 2026 |
Annual re-validation against incident history |
Common Key Risk Indicators Questions Practitioners Ask
What are key risk indicators?
Key risk indicators are measurable metrics tied to specific risks that provide early warning of rising exposure, each with a target, tolerance bands, and a named owner. They differ from performance metrics by predicting losses rather than recording achievements. Our
examples guide covers the definition with worked scorecards.
How many key risk indicators should an organization track?
Ten to fifteen per audience is the working ceiling, because attention is the scarce resource the program spends. The enterprise scorecard tracks the top exposures, each division tracks its own set, and the
150-KRI library exists for selection rather than wholesale adoption.
What is the difference between key risk indicators and KPIs?
KPIs measure progress toward objectives; key risk indicators measure movement toward losses. Revenue growth is a KPI, while customer concentration is a KRI, and one metric can serve both roles if its thresholds are written for each purpose. Confusing the two produces scorecards that celebrate while exposure climbs.
How do you set thresholds for key risk indicators?
Anchor thresholds to risk appetite, then back-test against incident history so the amber band would have fired usefully before your last three events. Define target, appetite, tolerance, and breach in observable numbers, and pre-agree the action each band triggers. The
scorecard build guide includes calibration worksheets.
Which key risk indicators should a small organization start with?
Start with five: cash runway or liquidity coverage, customer or revenue concentration, staff turnover in critical roles, overdue corrective actions, and system availability for whatever sells. The
free Excel template holds exactly this starter set, and the
50-KRI shortlist supplies the expansion path.
Can key risk indicators be automated?
The measurement layer automates well: most KRIs can draw from finance, HR, and monitoring systems on a schedule, and automation removes the keying errors that make manual scorecards unauditable. The judgment layer should stay human, meaning threshold setting, amber explanations, and the decision a red band forces.
How often should key risk indicators be reviewed and reported?
Measure at the metric’s natural velocity, weekly to monthly for most, and report trends quarterly to the board with every red band explained in one line. Re-validate the whole set annually against incidents and near misses, retiring anything that never moved or never mattered.
The Next Wave: Key Risk Indicator Trends Practitioners Can’t Ignore
Supervisory patience for unescalated warnings is gone. The post-SVB examination culture treats aging findings as a governance failure in itself, and the
SEC’s disclosure regime extends the same logic to public companies: if your indicators knew, regulators will ask when you did.
Continuous monitoring is replacing the monthly snapshot across most risk categories. As data feeds automate, the interesting design question shifts from measurement frequency to alert discipline, because a key risk indicator that pages someone hourly gets muted by February. Threshold quality becomes the whole game.
Expect AI to propose and challenge indicators. Models are already good at flagging metric drift and suggesting leading indicators from incident text, and the practitioner’s edge moves to the SVB question: making sure something happens when the number turns red.
Climate and third-party indicators are the growth categories to watch. Disclosure regimes keep pulling climate metrics from sustainability reports into risk scorecards, and vendor-origin incidents keep proving that a supplier’s health is your exposure, which is why both categories now have dedicated guides in this directory.
More Key Risk Indicator Guides
By business function
By industry
By risk type
Foundations, templates and comparisons
Stand Up a Key Risk Indicator Program With Risk Publishing
If your scorecard has never triggered an escalation, it is either a miracle or a design flaw, and miracles are rare. Explore
our services or
contact us to build or re-validate a key risk indicator program, thresholds and escalation rules included, calibrated against your last three years of incidents and near misses.
Get the ERM Risk Register Template (Excel)
Put this guide into practice without building from scratch: a ready-to-use Excel risk register with a live dashboard, 5×5 inherent and residual heatmaps, automatic risk appetite testing, and a KRI tracker. Aligned to ISO 31000:2018 and COSO ERM, with 12 worked sample risks included.
Buy the Risk Register Template – $29
Chris Ekai is a Risk Management expert with over 10 years of experience in the field. He has a Master’s(MSc) degree in Risk Management from University of Portsmouth and is a CPA and Finance professional. He currently works as a Content Manager at Risk Publishing, writing about Enterprise Risk Management, Business Continuity Management and Project Management.