Enterprise risk management is the coordinated process an organization uses to identify, assess, treat and monitor every risk that could affect its objectives. It covers strategic, financial, operational and compliance exposures under one framework, one rating scale and one reporting line. The aim is a single view of total exposure rather than a stack of departmental lists.
On 4 May 2026 the Committee of Sponsoring Organizations of the Treadway Commission, the body that wrote the definition most companies quote, published From Guidance to Action: Exploring Practical Enterprise Risk Management. Its headline number was 7%. That is the share of risk leaders who said their program was fully integrated into strategy decisions.
| Enterprise Risk Management: Key Takeaways |
| Enterprise risk management means running one process, one rating scale and one reporting line across every risk category that can move the organization’s objectives, instead of a separate list per department. |
| COSO published From Guidance to Action on 4 May 2026, reporting that only 7% of risk leaders say enterprise risk management is fully integrated into strategy decisions while 98% believe it should play a bigger strategic role. |
| The two reference documents are the COSO ERM framework, revised in 2017 around five components and 20 principles, and ISO 31000:2018, which sets out principles, framework and process in three linked clauses. |
| Scope is the test that separates enterprise risk management from ordinary risk work: strategic, financial, operational, compliance, technology, third party, climate and reputational exposures all sit inside the same view. |
| Accountability splits four ways. The board approves appetite and oversees the process, executives own the decisions, the risk function owns the method, and business units own the individual risks. |
| The Jaguar Land Rover shutdown that began on 2 September 2025 cost the company GBP 196 million directly and was modeled by the Cyber Monitoring Centre at GBP 1.9 billion across the wider UK economy. |
| Maturity is measured by influence, not documentation. A program works when a risk finding has visibly changed a capital allocation, a pricing decision or a go/no-go call in the past twelve months. |
The same research found that 98% believed enterprise risk management should play a more strategic role, and more than half described their program as a compliance or assurance function. Lucia Wind, COSO’s executive director and chair, framed the problem plainly: organizations face unprecedented complexity, and enterprise risk management must evolve to keep pace.
That gap between the definition and the daily reality is the honest starting point for anyone asking what the term means. The paper was authored by Ryan Luttenton, Stefany Samp and Alexa Stone of Crowe LLP, and the Institute of Internal Auditors covered its release in June 2026.
What Enterprise Risk Management Actually Means
Strip away the vendor language and the idea is narrow. Enterprise risk management is a governance process that puts every material exposure onto one register, scores it on one scale, assigns it to a named owner, and reports it through one line to the board. Everything else is implementation detail.
The word doing the work is enterprise. A treasury team managing currency exposure is practicing risk management, competently. It becomes enterprise risk management only when that currency position is visible alongside cyber, supply chain and regulatory exposures, on a scale that lets an executive compare them.
Standards bodies phrase this differently but agree on substance. The table below sets the four definitions most often cited in US board papers side by side, which is useful when a policy has to reference one of them and a regulator may ask which.
| Source | Definition in brief | What it emphasizes |
| COSO ERM (2017) | Culture, capabilities and practices integrated with strategy setting and performance, relied on to manage risk in creating, preserving and realizing value. | Strategy and performance. Risk is framed as an input to value, not a separate compliance exercise. |
| ISO 31000:2018 | Coordinated activities to direct and control an organization with regard to risk, built on principles, a framework and a process. | Process discipline and integration. Deliberately generic so any sector or entity size can apply it. |
| Institute of Risk Management | A process that lets an organization understand and manage the full range of risks it faces across all activities and levels. | Breadth of coverage and the link between risk work and organizational levels. |
| NC State ERM Initiative | A process that identifies and prioritizes the most significant risks to the entity’s strategy, then assigns ownership for managing them. | Prioritization. The point is the top risks the board must know about, not an exhaustive catalogue. |
Table 1. Four widely cited definitions of enterprise risk management, and what each one puts at the center.
The COSO wording is the one to know for US filings, and the full enterprise risk management framework text sits on COSO’s site. The ISO 31000:2018 standard is the reference for international and non-listed entities, and our plain-language walkthrough of ISO 31000 covers the clause structure.
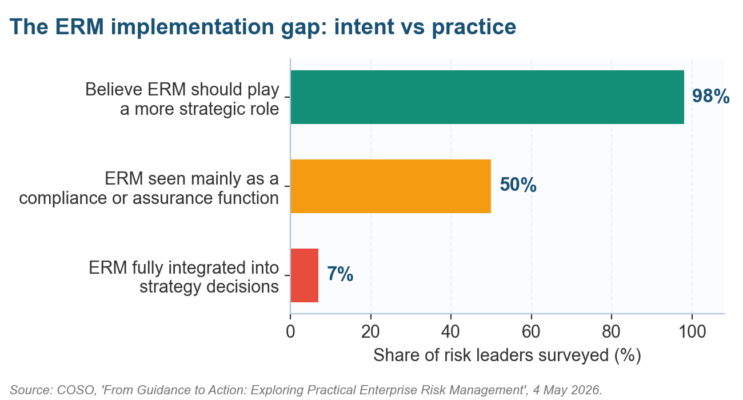
Figure 1. COSO’s own 2026 research puts the distance between what enterprise risk management is meant to do and what it currently does at ninety-one percentage points.
How the Definition Arrived, and Why It Keeps Moving
That 7% figure is less surprising once you follow how the discipline developed. The term entered mainstream corporate use after COSO published its first enterprise risk management framework in 2004, in the wake of the accounting scandals that produced Sarbanes-Oxley. It was born in a control environment, and the birthmark shows.
The 2017 revision was an attempt to move the discipline out of the assurance corner. COSO retitled the framework Integrating with Strategy and Performance and rebuilt it around five components and 20 principles. Our breakdown of the five components and 20 principles maps each one to a practical artifact.
| Year | Milestone | What changed in practice |
| 2004 | COSO publishes the first ERM Integrated Framework | Introduced the cube model and gave boards a vocabulary. Programs anchored heavily on internal control and compliance. |
| 2009 | ISO 31000 first published | Offered a sector-neutral alternative built on principles and process rather than components, and travelled well outside the US. |
| 2017 | COSO releases ERM: Integrating with Strategy and Performance | Replaced the cube with five components and 20 principles, and moved the emphasis from control to strategy setting. |
| 2018 | ISO 31000 revised | Simplified the language, put leadership commitment at the center, and made the framework easier to apply in smaller entities. |
| 2026 | COSO publishes From Guidance to Action | Shifted the question from how to document a program to whether it changes decisions, and reported the 7% integration figure. |
Table 2. Two decades of enterprise risk management guidance, and what each revision was trying to fix.
Notice the direction of travel. Each revision pushed the discipline further from paperwork and closer to decisions, which tells you what good looks like in 2026. The 2026 guidance is available through COSO’s ERM library, and CPA Practice Advisor summarized its practical thrust on release.
Choosing between the two reference documents matters less than most committees assume, since the process steps overlap almost entirely. Where it does matter is audit language and international operations, which we work through in our comparison of ISO 31000 and the COSO ERM framework.
The Difference Between One Register and One View
Most organizations that believe they lack enterprise risk management already run the component parts. Finance models downside scenarios, security maintains a threat register, and operations reviews incidents every month. What is missing is the connective layer that lets a director read those three artifacts as one exposure.
The practical difference shows up in the conversation, not the document. In a siloed setup, each function reports that its own risks are managed, and all three can be telling the truth while the organization remains exposed to a scenario that crosses them. Aggregation is the whole point.
| Dimension | Siloed risk management | Enterprise risk management |
| Scope | One function, one risk family, usually mapped to that team’s objectives. | Every category that can move enterprise objectives, including ones no single function owns. |
| Scoring | Each team uses its own scale, so a high in IT may not equal a high in treasury. | One likelihood and impact scale, calibrated so scores are comparable across functions. |
| Ownership | Implied by function. The person accountable is whoever runs the department. | Named individual per risk, recorded in the register, with a documented escalation route. |
| Appetite | Rarely stated. Tolerance is inferred from precedent and budget. | Written appetite statement approved by the board, with quantified limits per category. |
| Aggregation | Not attempted. Correlated exposures stay invisible until they arrive together. | Explicit. Correlations and concentrations are assessed and reported as combined exposure. |
| Reporting | Into functional management, on the functional cycle. | One consolidated report to the board or risk committee on a fixed cadence. |
Table 3. The six places where an enterprise risk management view behaves differently from a set of functional registers.
Operational risk is where this distinction is most often blurred, because a mature operational function looks a great deal like enterprise risk management from the outside. We separate the two in detail in our guide to how operational risk differs from enterprise risk, and the operational risk management overview covers the narrower discipline.
Five Components That Hold a Program Together
COSO’s 2017 structure is the clearest available answer to what a program is actually made of. Five components carry 20 principles between them, and each component produces artifacts a board can inspect. An enterprise risk management program missing any one of them tends to fail in a predictable way.
| Component | What it covers | Evidence a board can inspect |
| Governance and culture | Board oversight, operating structures, defined behaviors and the tone leadership sets on risk. | Board risk committee charter, approved risk policy, and minutes showing risk debated before a decision. |
| Strategy and objective-setting | Risk appetite, the risk in alternative strategies, and business objectives that carry risk tolerances. | Signed appetite statement with quantified limits, plus risk analysis attached to the strategic plan. |
| Performance | Identification, severity assessment, prioritization, response selection and portfolio view. | Current risk register with scores, owners, treatment plans and a consolidated portfolio summary. |
| Review and revision | Assessing substantial change, reviewing risk and performance, and improving the program itself. | Documented annual framework review and evidence that scores moved after a real event. |
| Information, communication and reporting | Risk information systems, communication channels and reporting to the right people at the right time. | Board pack with trended indicators, escalation log, and a dated distribution record. |
Table 4. The five COSO ERM components, and the specific evidence each one should leave behind.
Three of those artifacts do most of the work in practice, and they are the ones worth building first. Getting them right is usually the difference between an enterprise risk management program that survives an executive turnover and one that quietly lapses when its sponsor moves on:
- A risk appetite statement with numbers in it, not adjectives. Our library of risk appetite statement examples and the sector-by-sector versions show the difference.
- A register that records inherent score, control effectiveness and residual score separately, so the reader can see what the controls are actually buying. The inherent versus residual risk method sets out the arithmetic.
- Indicators with thresholds attached and a named person who acts when one breaches, drawn from a defined set of key risk indicators rather than whatever the reporting system happens to produce.
The register itself is the component most often over-engineered. A workable one fits the risks a board can act on rather than everything a workshop generated, and our risk register template and build guide keeps the field list deliberately short.
The Four Steps Every Program Runs Through
Components describe what an enterprise risk management program contains. The process describes what it does each cycle, and ISO 31000:2018 sets that sequence out in clause 6 in terms any team can follow. Four steps carry the work, and each is supposed to end in a decision rather than a document.
| Step | What the team actually does | The decision it should produce |
| Identify | Surface exposures from loss data, audit findings, workshops, indicator trends and external incidents in the sector. | Which exposures enter the register this cycle, and which are explicitly ruled out of scope. |
| Assess | Score likelihood and impact on the enterprise scale, record control effectiveness, and derive a residual position. | Which risks sit outside appetite and therefore need treatment funded this year. |
| Respond | Select treat, transfer, tolerate or terminate, then attach an owner, a budget and a completion date. | What the organization will spend, insure, accept or stop doing about each priority risk. |
| Monitor and review | Track indicators against thresholds, retest controls, and feed real events back into the scores. | Whether the earlier assessment held, and which scores must move before the next board report. |
Table 5. The ISO 31000 process in four steps, expressed as decisions rather than deliverables.
Two steps get compressed in practice, and they are almost always the last two. Teams treat monitoring as reporting, which is passive, then skip the review that asks whether the original assessment was right. Feeding actual loss events back into scores is what keeps a register honest across cycles.
Sequencing beats sophistication for a first cycle. Running all four steps roughly on a narrow scope produces more usable output than running the first step immaculately across everything, and our risk management lifecycle guide sets out a calendar that most teams can actually sustain.
A worked example: one supplier risk through all four steps
Abstract process descriptions are where most explanations stop, so here is a single risk carried end to end on a 5×5 scale. The case is a mid-sized manufacturer whose finishing line depends on one coatings supplier, which is the concentration pattern the Jaguar Land Rover shutdown made expensive.
| Step | What was done | The number it produced |
| Identify | Spend analysis showed 71% of coatings volume with one vendor, single-sourced, on a 12-week requalification lead time. | One register entry: sole-source dependency on the finishing input, owned by the procurement director. |
| Assess | Likelihood 3 (a disruption every three to four years across the vendor’s sector). Impact 5 (line stops within nine days). | Inherent score 15. Controls rated partially effective, so residual holds at 12, above the appetite limit of 9. |
| Respond | Qualify a second supplier for 25% of volume and hold six weeks of buffer stock on the critical coating. | Treatment funded at 340,000 dollars over two quarters, against a modeled nine-day stoppage cost of 2.1 million. |
| Monitor | Two indicators: second-supplier qualification progress, and buffer cover in weeks against a four-week floor. | Residual score reassessed at 6 once qualification completed, evidenced and reported to the audit committee. |
Table 6. One risk carried through the full process, with the numbers that made each decision defensible.
Three things in that example are what make it enterprise risk management work rather than procurement work. The impact was scored in enterprise terms, the appetite limit came from a board-approved statement, and the treatment competed for capital against other risks on the same scale.
The arithmetic also answers the budget question before it is asked. Spending 340,000 dollars to avoid a modeled 2.1 million dollar exposure is a decision a finance director can sign, and the inherent versus residual scoring method is what makes the before and after positions comparable.
Who Owns What, From the Board to the Front Line
Ask five people in one company who owns risk and you will often get five answers, which is itself a finding. Accountability in a functioning enterprise risk management program splits cleanly across four levels, and the split is what stops the risk function from being blamed for exposures it never controlled.
| Level | Accountable for | Common failure at this level |
| Board or risk committee | Approving appetite, overseeing that the process works, and challenging management’s risk view. | Receiving a heat map, asking no questions, and treating the item as an information paper. |
| Chief executive and executives | Owning the decisions risk analysis informs, and resourcing treatment plans they have approved. | Endorsing appetite in a meeting, then approving a decision that breaches it without recording an exception. |
| Risk function | Owning the method, the scale, the calendar and the consolidated report. Not owning the risks. | Drifting into ownership of every risk, which turns the function into a bottleneck and dilutes accountability. |
| Business units and process owners | Identifying, scoring and treating the risks inside their own operations against the enterprise scale. | Scoring to protect the department rather than to inform the board, which quietly corrupts the aggregate view. |
Table 7. Four levels of enterprise risk management accountability, and the failure each one is prone to.
This structure is the three lines model in different clothing, and the mapping is worth making explicit in a policy so auditors can follow it. Our explainer on the three lines of defense model covers the 2020 update, which loosened the original defensive framing.
Seniority of the risk lead is a reasonable proxy for how seriously the structure is taken. Where the role reports two levels below the chief executive, appetite tends to be advisory in practice, and our chief risk officer salary data by US state shows how widely the role is graded.
Why Enterprise Risk Management Changes Decisions
The case for enterprise risk management is often made in terms of losses avoided, which is unprovable and therefore unpersuasive to a chief financial officer. The stronger case is decision quality, and it is measurable. An enterprise risk management program pays for itself when it changes what the organization decides to do.
Capital allocation is the clearest example. When a risk analysis forces a hurdle rate up on a project in an unstable jurisdiction, or attaches a contingency to an acquisition because integration risk was quantified, the enterprise risk management program has produced a number that moved money. That is auditable value.
Where boards are directing that money in 2026 is documented. Protiviti and the NC State ERM Initiative surveyed 1,540 board members and C-suite executives worldwide for their 14th annual Executive Perspectives on Top Risks report, and the investment pattern is concentrated rather than scattered.
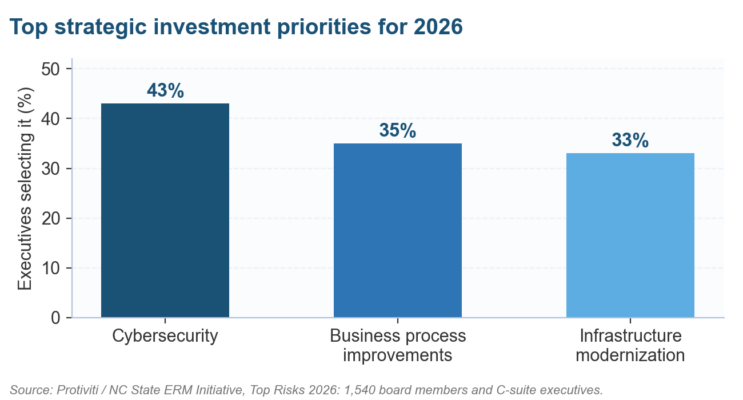
Figure 2. Cybersecurity leads strategic investment priorities for 2026, named by 43% of the 1,540 executives surveyed.
The four benefits below are the ones that survive scrutiny in a budget conversation, because each leaves an observable artifact behind rather than resting on a claim about disasters that never happened. Every one can be evidenced from documents a finance director already receives:
- Priced decisions. Risk analysis changes a hurdle rate, a reserve or a contract term, and the change is traceable in the approval papers.
- Faster response. Named owners and pre-agreed escalation thresholds cut the hours lost to deciding who decides when an event begins.
- Cheaper assurance. A single register that internal audit, GRC reporting and regulators can all reference removes duplicated evidence gathering across three cycles.
- Credible external reporting. Rating agencies, insurers and lenders read risk disclosures, and a program that can evidence its process supports better terms.
Regulated sectors get an additional argument, since supervisors examine the process directly. Insurers face own risk and solvency assessment requirements set out by the National Association of Insurance Commissioners, and banks work to Basel operational risk standards alongside FFIEC examination expectations.
What One Shutdown at Jaguar Land Rover Exposed
The clearest recent illustration of why scope matters is not a governance study. On 2 September 2025 Jaguar Land Rover confirmed a cyber incident and halted production across its major plants, and the effects ran far past the company that suffered the breach.
The Cyber Monitoring Centre, an independent UK body that categorizes and sizes systemic cyber events, modeled the total economic impact at GBP 1.9 billion, within a range of GBP 1.6 billion to GBP 2.1 billion. It described the event as the most economically damaging cyber incident to hit the UK.
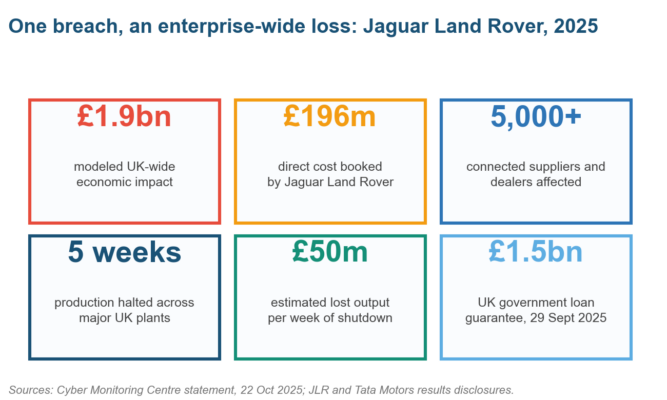
Figure 3. A single intrusion propagated into supply chain, liquidity, employment and sovereign exposure inside five weeks.
Read the panel as a risk taxonomy rather than a news summary. The initial event was technology risk. Within days it was operational risk, then supplier and counterparty risk across more than 5,000 connected organizations, then liquidity risk severe enough that the UK government approved a GBP 1.5 billion loan guarantee on 29 September 2025.
No single functional register would have carried that chain. A security register would have logged the intrusion vector, and a treasury model would have held the liquidity buffer, but only an enterprise view asks what happens to the buffer when the plants stop. The Cyber Monitoring Centre publishes its methodology for anyone wanting to test the modeling.
Two practical items follow for anyone building an enterprise risk management program. Concentration in the supplier base needs assessing as a named risk, which our third-party risk management framework sets out, and recovery assumptions need testing against a multi-week outage using a business impact analysis rather than a one-day scenario.
How the Same Discipline Lands in Different Sectors
The definition holds everywhere, but what an enterprise risk management program spends its time on varies sharply by sector, and so does the regulator reading over its shoulder. A healthcare board and a bank board can both run credible enterprise risk management programs that share almost no content beyond the method.
| Sector | Where the program concentrates | The external anchor it answers to |
| Banking | Credit, liquidity, model and operational risk, with capital consequences attached to each assessment. | Basel operational risk standards, FFIEC examination guidance and supervisory expectations on model risk. |
| Insurance | Underwriting, reserving and catastrophe accumulation, tested through forward-looking solvency scenarios. | NAIC own risk and solvency assessment filings, reviewed annually by the state regulator. |
| Healthcare | Patient safety, clinical incident reporting, privacy and continuity of critical care services. | HIPAA obligations, accreditation standards and state licensing conditions. |
| Manufacturing | Supplier concentration, plant availability, product quality and industrial safety exposure. | OSHA requirements, customer audit programs and contractual supply commitments. |
| Technology | Availability, data protection, model behavior and dependency on a small set of platform providers. | The NIST Cybersecurity Framework, sectoral privacy law and customer security attestations. |
| Public sector | Program delivery, fiscal exposure, procurement integrity and public accountability. | Audit office findings, statutory reporting duties and legislative oversight committees. |
Table 8. What the same enterprise risk management method concentrates on across six sectors.
Financial services carries the heaviest external load, which is why its programs tend to be the most quantified. Our guides to operational risk management in banking, model risk management and continuity planning in banking cover the specific expectations examiners test.
Regulated non-financial sectors follow the same pattern with different vocabulary. The controls and evidence differ, but the register, the appetite statement and the escalation route look remarkably similar, as our work on pharmaceutical risk management and insurance key risk indicators shows.
One category is crossing every sector at once. AI governance now appears on board agendas in organizations that have no technology risk function, and the NIST AI Risk Management Framework has become the reference most US programs adopt when they need structure quickly.
Measuring Whether an Enterprise Risk Management Program Is Working
Enterprise risk management maturity models are easy to game, because documentation is cheap and influence is not. The version below grades on evidence of influence instead, which is the standard COSO’s 2026 paper effectively adopted when it asked whether enterprise risk management programs reach real decisions.
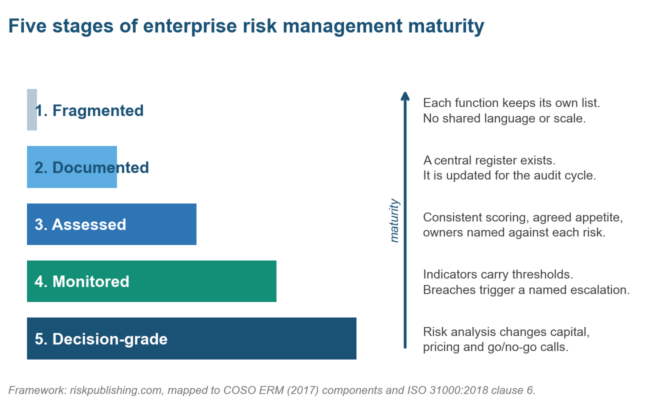
Figure 4. Five maturity stages. Most enterprise risk management programs that describe themselves as mature are sitting at stage two or three.
Stage two is the trap, and it is crowded. A central register exists, it is refreshed before each audit cycle, and nothing downstream changes as a result. The register is real work that produces no decisions, which is precisely the pattern COSO measured.
| Question to ask | Weak answer | Strong answer |
| Name a decision that changed because of risk analysis in the last year. | General reference to improved awareness or better conversations. | A specific project, contract or capital call, with the date and the amount the analysis moved. |
| What is your appetite for the largest risk category? | A qualitative statement such as low or moderate. | A quantified limit with a threshold, an owner and a documented exception route. |
| When did a risk score last go down, and why? | Scores are stable, or nobody can recall a movement. | A named control was implemented, tested, and the residual score was reduced with evidence attached. |
| Who acted the last time an indicator breached? | The breach was noted in the next quarterly report. | A named person acted within a defined window, and the action is logged against the indicator. |
| How do you know the register is complete? | Workshops were held with each department. | Coverage is tested against loss events, audit findings and external incidents in the sector. |
Table 9. Five diagnostic questions that separate documented enterprise risk management programs from decision-grade ones.
Reporting format carries more weight here than most teams expect, since a board that cannot read the pack cannot challenge it. Trended indicators outperform static heat maps, and our board-ready enterprise risk management dashboard examples and risk heat map template show both formats side by side.
Control testing deserves its own cadence rather than riding on the register refresh. A risk and control self-assessment gives the residual scores something to stand on, and the NIST Cybersecurity Framework supplies a control vocabulary that maps cleanly onto technology risks.
The Enterprise Risk Management Questions Boards Keep Asking
What is meant by enterprise risk management in simple terms?
It means managing all of an organization’s significant risks through one process instead of department by department. The same scale scores a cyber threat and a currency exposure, the same register holds both, and one report goes to the board. That comparability is what the word enterprise adds.
How is enterprise risk management different from traditional risk management?
Traditional risk management treats each risk family separately, inside the function that owns it. Enterprise risk management aggregates them, looks for correlations between them, and ties the total to strategic objectives. The difference is coverage and comparability rather than technique, since the assessment steps are similar.
Which enterprise risk management framework should we adopt, COSO or ISO 31000?
US listed companies usually reference COSO because auditors and regulators recognize its language. ISO 31000:2018 suits international groups, private companies and organizations that already run ISO management systems. The process steps overlap heavily, so the choice affects documentation more than method, as our side-by-side comparison shows.
Who is responsible for enterprise risk management in an organization?
Four groups share it. The board approves appetite and oversees the process, executives own the decisions the analysis informs, the risk function owns the method and the consolidated report, and business units own their individual risks. Concentrating all four in the risk function is the most common structural error.
What risks does an enterprise risk management program cover?
An enterprise risk management program covers everything capable of moving the organization’s objectives. That means strategic, financial, operational, compliance and technology risks, plus third-party exposures, geopolitical risk, ESG and climate risk and AI governance risk. Scope is the defining feature of the discipline.
How long does it take to implement enterprise risk management?
A workable first cycle takes six to nine months in a mid-sized organization: appetite agreed, register built, owners named, first board report delivered. Maturity beyond that is measured in years. Our guide to developing an enterprise risk management framework sets out the sequence and the realistic milestones.
Do small organizations need enterprise risk management?
Enterprise risk management scales down further than most people expect. A 200-person company can run a credible program on a single register, a quarterly executive review and six indicators. What does not scale down is the discipline of one scale and named owners, which is where small programs usually break.
What software does enterprise risk management require?
No dedicated enterprise risk management software, initially. A spreadsheet register runs a first cycle perfectly well, and buying a platform before the method is settled tends to encode a bad process. Once volume justifies it, our comparison of enterprise risk management software platforms covers what the categories actually differ on.
Seven Traps That Keep Enterprise Risk Management Programs Stuck on Paper
The failures below account for most of the distance between a documented enterprise risk management program and one that reaches decisions. Each of them carries a cheap and specific correction, which is why COSO’s 7% integration figure reads as disappointing rather than inevitable.
| Trap | What it looks like | The correction |
| Risk theater | A well-formatted register updated on schedule that no decision ever references. | Require every capital and strategic paper to carry a risk section, with the register entry cited. |
| Adjectival appetite | Appetite described as low, moderate or cautious, with no number anywhere. | Attach a quantified limit to each category and a route for approving exceptions. |
| Scale drift | Departments interpret a score of four differently, so aggregate rankings are meaningless. | Publish anchored scale definitions with monetary and time bands, then calibrate scores in a joint session. |
| Owner by committee | Risks assigned to a function or a group, so nobody is personally accountable. | Name an individual against every risk, and record the name in the board pack. |
| The completeness illusion | Coverage assumed because workshops were held in every department. | Test the register against actual loss events, audit findings and incidents at peer organizations. |
| Indicators without thresholds | Metrics reported as trends with no defined level that triggers action. | Set a threshold and an escalation owner for each indicator before it enters the pack. |
| Annual thinking | The register refreshes once a year while the risk environment moves monthly. | Split the cadence: full refresh annually, top risks quarterly, indicators monthly. |
Table 10. Seven recurring enterprise risk management failures, each with the correction that costs least to apply.
In our advisory work the second and fourth traps travel together most often. An appetite statement written in adjectives cannot be breached, so nothing escalates, and risks assigned to committees leave no one obliged to notice. Fixing either one usually surfaces the other within a quarter.
Sequencing the corrections matters as much as making them, since a program that tries all seven at once tends to stall. The risk management lifecycle and the underlying risk management process steps give a running order that most teams can sustain.
Where Risk Oversight Heads Next
Three shifts in enterprise risk management are already visible in the 2026 guidance and survey data. The first is the move from documentation to decision evidence, which COSO made explicit in May and the Institute of Internal Auditors is now teaching directly. Expect auditors to start asking which decision a register changed.
The second is technology risk absorbing categories that used to sit apart. Cybersecurity took 43% of executives’ strategic investment priority in the Protiviti and NC State 2026 top risks report, and AI governance is arriving as a board-level item rather than a technical one.
The third is the widening gap between programs that quantify and those that describe. The 2025 State of Risk Oversight report from NC State and the AICPA has tracked slow maturity growth for sixteen years, and quantification is where the leading quartile is now separating.
Start with the diagnostic questions in Table 9 rather than a maturity survey. If nobody can name a decision that risk analysis changed in the past twelve months, the program is at stage two whatever the documentation says, and that is a fixable problem with a known sequence. A structured way to assess risk management maturity turns that sequence into a scored, board-ready plan.
If you are a US executive or board member trying to move an enterprise risk management program from documented to decision-grade, we build appetite statements with real numbers and registers that survive audit scrutiny. See how we work with risk teams, then get in touch and bring your last board pack to the first conversation.

Chris Ekai is a Risk Management expert with over 10 years of experience in the field. He has a Master’s(MSc) degree in Risk Management from University of Portsmouth and is a CPA and Finance professional. He currently works as a Content Manager at Risk Publishing, writing about Enterprise Risk Management, Business Continuity Management and Project Management.